
Stoke-on-Trent North
Stoke-on-Trent North is a constituency[n 1] represented in the House of Commons of the UK Parliament by David Williams, a member of the Labour Party.[n 2]
Boundaries
Historic
1950–1955: The County Borough of Stoke-on-Trent wards numbers 1 to 9 and 27.
1955–1983: The County Borough of Stoke-on-Trent wards numbers 1 to 8.
1983–1997: The City of Stoke-on-Trent wards of Burslem Central, Burslem Green, Chell, East Valley, Norton and Bradeley, and Tunstall North, and the Borough of Newcastle-under-Lyme wards of Butt Lane, Kidsgrove, Newchapel, and Talke.
1997–2010: The City of Stoke-on-Trent wards of Burslem Central, Burslem Grange, Chell, East Valley, Norton and Bradeley, and Tunstall North, and the District of Staffordshire Moorlands wards of Brown Edge and Endon, and Stanley.
2010–2024: The City of Stoke-on-Trent wards of Burslem North, Burslem South, Chell and Packmoor, East Valley, Norton and Bradeley, and Tunstall, and the Borough of Newcastle-under-Lyme wards of Butt Lane, Kidsgrove, Ravenscliffe, and Talke.
Current
Under the 2023 Periodic Review of Westminster constituencies which came into effect for the 2024 general election, the constituency was defined as composing the following as they existed on 1 December 2020:
- The Borough of Newcastle-under-Lyme wards of: Kidsgrove & Ravenscliffe; Newchapel & Mow Cop; Talke & Butt Lane.
- The City of Stoke-on-Trent wards of: Baddeley, Milton and Norton; Bradeley and Chell Heath; Burslem Central; Burslem Park; Ford Green and Smallthorne; Goldenhill and Sandyford; Great Chell and Packmoor; Little Chell and Stanfield; Moorcroft; Tunstall.[2]
In order to bring the electorate within the permitted range, the Kidsgrove district of Newchapel was transferred from Staffordshire Moorlands. The boundary with Stoke-on-Trent Central was re-aligned to take account of revised ward boundaries.
Following a further local government boundary review in the City of Stoke-on-Trent which came into effect in May 2023,[3][4] the constituency now comprises the following from the 2024 general election:
- The Borough of Newcastle-under-Lyme wards of: Kidsgrove & Ravenscliffe; Newchapel & Mow Cop; Talke & Butt Lane.
- The City of Stoke-on-Trent wards of: Baddeley, Milton & Norton; Bradeley and Chell Heath; Burslem; Burslem Park; Ford Green & Smallthorne; Goldenhill & Sandyford; Great Chell & Packmoor; Little Chell & Stanfield; Moorcroft & Sneyd Green (majority); Tunstall; and a very small part of Etruria & Hanley.[5]
Constituency profile
Each of the three constituencies of Stoke-on-Trent contain two of the historic "six towns" of the Potteries. Burslem and Tunstall are Stoke-on-Trent North's long-established ceramics and porcelain settlements; see Staffordshire Potteries.
The area has relatively fast connections compared to other seats in the county, equally to Greater Manchester and the West Midlands. However, the area's traditional pottery industry has shed many jobs. Workless claimants, registered jobseekers, were in November 2012 higher than the national average of 3.8%, at 5.2% of the population based on a statistical compilation by The Guardian, the middle figure of the three rates for the city's seats.[6]
History
The constituency was created for the 1950 general election as the successor to the Burslem Division of Stoke-on-Trent. It also included parts of the Leek constituency which had been absorbed into the County Borough of Stoke-on-Trent.
- Political history
This seat and its predecessor had elected Labour MPs at every election since 1935, until Jonathan Gullis won the seat for the Conservatives from incumbent Ruth Smeeth in 2019. Labour's David Williams recaptured the seat from Gullis at the 2024 general election.
- Prominent members
As a frontbench member in government, John Forrester became in 1970 a Health Minister, before the election of that year.
Members of Parliament
Elections
Elections in the 2020s
| Party | Candidate | Votes | % | ±% | |
|---|---|---|---|---|---|
| Labour | David Williams | 14,579 | 40.3 | +5.5 | |
| Conservative | Jonathan Gullis | 9,497 | 26.3 | −27.8 | |
| Reform | Karl Beresford | 8,824 | 24.4 | +18.8 | |
| Green | Josh Harris | 1,236 | 3.4 | +2.0 | |
| Independent | Jag Boyapti | 1,103 | 3.1 | N/A | |
| Liberal Democrats | Lucy Hurds | 911 | 2.5 | −0.8 | |
| Majority | 5,082 | 14.1 | N/A | ||
| Turnout | 36,150 | 51.8 | −8.1 | ||
| Labourgain from Conservative | Swing | +16.6 | |||
Elections in the 2010s
| Party | Candidate | Votes | % | ±% | |
|---|---|---|---|---|---|
| Conservative | Jonathan Gullis | 20,974 | 52.3 |  7.0 7.0 | |
| Labour | Ruth Smeeth | 14,688 | 36.6 | 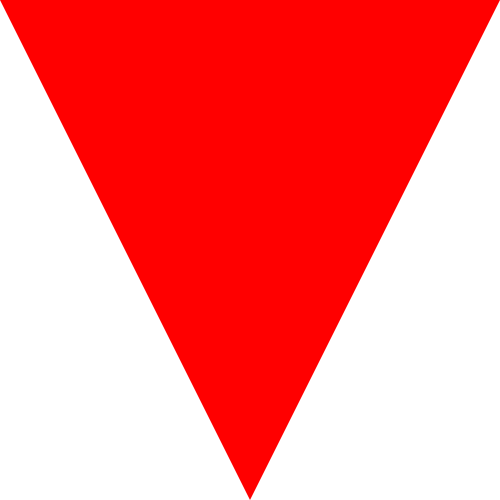 14.3 14.3 | |
| Brexit Party | Richard Watkin | 2,374 | 5.9 | New | |
| Liberal Democrats | Peter Andras | 1,268 | 3.2 | 1.0 | |
| Green | Alan Borgars | 508 | 1.3 | 0.3 | |
| Independent | Matthew Dilworth | 322 | 0.8 | New | |
| Majority | 6,286 | 15.7 | N/A | ||
| Turnout | 40,134 | 57.5 | 1.1 | ||
| Conservativegain from Labour | Swing | 10.7 | |||
| Party | Candidate | Votes | % | ±% | |
|---|---|---|---|---|---|
| Labour | Ruth Smeeth | 21,272 | 50.9 | 11.0 | |
| Conservative | Benedict Adams | 18,913 | 45.3 | 17.9 | |
| Liberal Democrats | Richard Whelan | 916 | 2.2 | 0.7 | |
| Green | Doug Rouxel | 685 | 1.6 | 1.2 | |
| Majority | 2,359 | 5.6 | 6.9 | ||
| Turnout | 41,786 | 58.6 | 5.4 | ||
| Labourhold | Swing | 3.4 | |||
| Party | Candidate | Votes | % | ±% | |
|---|---|---|---|---|---|
| Labour | Ruth Smeeth | 15,429 | 39.9 | 4.4 | |
| Conservative | Benedict Adams | 10,593 | 27.4 | 3.6 | |
| UKIP | Geoff Locke | 9,542 | 24.7 | 18.5 | |
| Liberal Democrats | Paul Roberts | 1,137 | 2.9 | 14.8 | |
| Green | Sean Adam | 1,091 | 2.8 | New | |
| Independent | John Millward | 508 | 1.3 | New | |
| Independent | Craig Pond[12][13] | 354 | 0.9 | New | |
| Majority | 4,836 | 12.5 | 8.0 | ||
| Turnout | 38,654 | 53.2 | 2.6 | ||
| Labourhold | Swing | 4.0 | |||
| Party | Candidate | Votes | % | ±% | |
|---|---|---|---|---|---|
| Labour | Joan Walley | 17,815 | 44.3 | 11.5 | |
| Conservative | Andy Large | 9,580 | 23.8 | 6.0 | |
| Liberal Democrats | John Fisher | 7,120 | 17.7 | 4.2 | |
| BNP | Melanie Baddeley | 3,196 | 8.0 | 2.0 | |
| UKIP | Geoff Locke | 2,485 | 6.2 | 2.1 | |
| Majority | 8,235 | 20.5 | 11.9 | ||
| Turnout | 40,196 | 55.8 | 4.9 | ||
| Labourhold | Swing | 8.8 | |||
Elections of the 2000s
| Party | Candidate | Votes | % | ±% | |
|---|---|---|---|---|---|
| Labour | Joan Walley | 16,191 | 52.6 | −5.4 | |
| Conservative | Benjamin Browning | 6,155 | 20.0 | +1.2 | |
| Liberal Democrats | Henry Jebb | 4,561 | 14.8 | +2.9 | |
| BNP | Spencer Cartlidge | 2,132 | 6.9 | New | |
| UKIP | Eileen Braithwaite | 696 | 2.3 | New | |
| Veritas | Ian Taylor | 689 | 2.2 | New | |
| Independent | Harry Chesters | 336 | 1.1 | New | |
| Majority | 10,036 | 32.6 | −6.6 | ||
| Turnout | 30,760 | 52.7 | +0.8 | ||
| Labourhold | Swing | -3.3 | |||
| Party | Candidate | Votes | % | ±% | |
|---|---|---|---|---|---|
| Labour | Joan Walley | 17,460 | 58.0 | −7.2 | |
| Conservative | Benjamin Browning | 5,676 | 18.8 | −1.4 | |
| Liberal Democrats | Henry Jebb | 3,580 | 11.9 | +1.2 | |
| Independent | Charles Wanger | 3,399 | 11.3 | New | |
| Majority | 11,784 | 39.2 | −5.8 | ||
| Turnout | 30,115 | 51.9 | −13.4 | ||
| Labourhold | Swing | -2.9 | |||
Elections of the 1990s
| Party | Candidate | Votes | % | ±% | |
|---|---|---|---|---|---|
| Labour | Joan Walley | 25,190 | 65.2 | +8.5 | |
| Conservative | Christopher Day | 7,798 | 20.2 | −9.0 | |
| Liberal Democrats | Henry Jebb | 4,141 | 10.7 | −2.6 | |
| Referendum | Jennefer Tobin | 1,537 | 4.0 | New | |
| Majority | 17,392 | 45.0 | +17.5 | ||
| Turnout | 38,664 | 65.3 | −8.1 | ||
| Labourhold | Swing | +11.9 | |||
| Party | Candidate | Votes | % | ±% | |
|---|---|---|---|---|---|
| Labour | Joan Walley | 30,464 | 56.7 | +9.6 | |
| Conservative | Laurence Harris | 15,687 | 29.2 | −2.1 | |
| Liberal Democrats | John Redfern | 7,167 | 13.3 | −8.3 | |
| Natural Law | Alan Morrison | 387 | 0.7 | New | |
| Majority | 14,777 | 27.5 | +11.7 | ||
| Turnout | 53,705 | 73.4 | +0.5 | ||
| Labourhold | Swing | +5.9 | |||
Elections of the 1980s
| Party | Candidate | Votes | % | ±% | |
|---|---|---|---|---|---|
| Labour | Joan Walley | 25,459 | 47.1 | +0.8 | |
| Conservative | Reginald Davies | 16,946 | 31.3 | +0.4 | |
| SDP | Stephen Simmonds | 11,665 | 21.6 | −1.2 | |
| Majority | 8,513 | 15.8 | +0.4 | ||
| Turnout | 54, 070 | 72.9 | +1.9 | ||
| Labourhold | Swing | +0.2 | |||
| Party | Candidate | Votes | % | ±% | |
|---|---|---|---|---|---|
| Labour | John Forrester | 24,721 | 46.3 | −13.1 | |
| Conservative | Roger Ibbs | 16,518 | 30.9 | +0.3 | |
| SDP | Trevor Beswick | 12,186 | 22.8 | +13.6 | |
| Majority | 8,203 | 15.4 | −13.3 | ||
| Turnout | 53,425 | 71.0 | −1.7 | ||
| Labourhold | Swing | ||||
Elections of the 1970s
| Party | Candidate | Votes | % | ±% | |
|---|---|---|---|---|---|
| Labour | John Forrester | 25,652 | 59.36 | ||
| Conservative | Roger Ibbs | 13,228 | 30.61 | ||
| Liberal | Clive Smedley | 3,994 | 9.24 | ||
| National Front | C Baugh | 341 | 0.79 | New | |
| Majority | 12,424 | 28.75 | |||
| Turnout | 43,215 | 72.75 | |||
| Labourhold | Swing | ||||
| Party | Candidate | Votes | % | ±% | |
|---|---|---|---|---|---|
| Labour | John Forrester | 25,264 | 60.59 | ||
| Conservative | JWD Davies | 10,192 | 24.44 | ||
| Liberal | M Smith | 6,239 | 14.96 | New | |
| Majority | 15,072 | 36.15 | |||
| Turnout | 41,695 | 69.61 | |||
| Labourhold | Swing | ||||
| Party | Candidate | Votes | % | ±% | |
|---|---|---|---|---|---|
| Labour | John Forrester | 28,177 | 64.19 | ||
| Conservative | J Davies | 15,718 | 35.81 | ||
| Majority | 12,459 | 28.38 | |||
| Turnout | 43,895 | 73.95 | |||
| Labourhold | Swing | ||||
| Party | Candidate | Votes | % | ±% | |
|---|---|---|---|---|---|
| Labour | John Forrester | 20,642 | 66.19 | ||
| Conservative | JS Heath | 10,542 | 33.81 | ||
| Majority | 10,100 | 32.38 | |||
| Turnout | 31,184 | 52.95 | |||
| Labourwin (new seat) | |||||
Elections of the 1960s
| Party | Candidate | Votes | % | ±% | |
|---|---|---|---|---|---|
| Labour | John Forrester | 28,491 | 71.54 | ||
| Conservative | LCN Bury | 11,335 | 28.46 | ||
| Majority | 17,156 | 43.08 | |||
| Turnout | 39,826 | 72.44 | |||
| Labourhold | Swing | ||||
| Party | Candidate | Votes | % | ±% | |
|---|---|---|---|---|---|
| Labour Co-op | Harriet Slater | 27,584 | 64.74 | ||
| Conservative | B David Barton | 15,025 | 35.26 | ||
| Majority | 12,559 | 29.48 | |||
| Turnout | 42,609 | 76.24 | |||
| Labour Co-ophold | Swing | ||||
Elections of the 1950s
| Party | Candidate | Votes | % | ±% | |
|---|---|---|---|---|---|
| Labour Co-op | Harriet Slater | 29,336 | 63.97 | ||
| Conservative | Samuel Middup | 16,522 | 36.03 | ||
| Majority | 12,814 | 27.94 | |||
| Turnout | 45,858 | 78.61 | |||
| Labour Co-ophold | Swing | ||||
| Party | Candidate | Votes | % | ±% | |
|---|---|---|---|---|---|
| Labour Co-op | Harriet Slater | 29,473 | 66.87 | ||
| Conservative | Samuel Middup | 14,599 | 33.13 | ||
| Majority | 14,874 | 33.74 | |||
| Turnout | 44,072 | 75.31 | |||
| Labour Co-ophold | Swing | ||||
| Party | Candidate | Votes | % | ±% | |
|---|---|---|---|---|---|
| Labour Co-op | Harriet Slater | 23,103 | 75.49 | +4.05 | |
| Conservative | Samuel Middup | 7,502 | 24.51 | −4.05 | |
| Majority | 15,601 | 50.98 | +8.10 | ||
| Turnout | 30,605 | ||||
| Labourhold | Swing | ||||
| Party | Candidate | Votes | % | ±% | |
|---|---|---|---|---|---|
| Labour | Albert Davies | 36,692 | 71.44 | ||
| National Liberal | James Coventry | 14,668 | 28.56 | ||
| Majority | 22,024 | 42.88 | |||
| Turnout | 51,360 | 83.81 | |||
| Labourhold | Swing | ||||
| Party | Candidate | Votes | % | ±% | |
|---|---|---|---|---|---|
| Labour | Albert Davies | 36,896 | 71.58 | ||
| Conservative | PW Hodgens | 14,647 | 28.42 | ||
| Majority | 22,249 | 43.16 | |||
| Turnout | 51,543 | 85.01 | |||
| Labourwin (new seat) | |||||
See also
Notes
- ↑A borough constituency (for the purposes of election expenses and type of returning officer)
- ↑As with all constituencies, the constituency elects one Member of Parliament (MP) by the first past the post system of election at least every five years.
References
- ↑"Electorate Figures – Boundary Commission for England". 2011 Electorate Figures. Boundary Commission for England. 4 March 2011. Archived from the original on 6 November 2010. Retrieved 13 March 2011.
- ↑"The Parliamentary Constituencies Order 2023". Schedule 1 Part 8 West Midlands region.
- ↑LGBCE. "Stoke-on-Trent | LGBCE". lgbce.org.uk. Retrieved 10 April 2024.
- ↑"The Stoke-on-Trent (Electoral Changes) Order 2022".
- ↑"New Seat Details – Stoke-on-Trent North". electoralcalculus.co.uk. Retrieved 10 April 2024.
- ↑Unemployment claimants by constituencyThe Guardian
- ↑Leigh Rayment's Historical List of MPs – Constituencies beginning with "S" (part 5)
- ↑"Stoke-on-Trent North". BBC News. Retrieved 2 July 2024.
- ↑"Stoke-on-Trent North Parliamentary constituency". BBC News. Retrieved 1 November 2019.
- ↑"General Election 2017: Who is standing in your constituency?". Stoke Sentinel. Archived from the original on 13 May 2017. Retrieved 13 May 2017.
- ↑"Election Data 2015". Electoral Calculus. Archived from the original on 17 October 2015. Retrieved 17 October 2015.
- ↑"- Get it off your chest". Archived from the original on 28 January 2015. Retrieved 27 January 2015.
- ↑"Craig Pond is standing as an independent nationalist in Stoke-on-Trent North", BBC News, London, 9 February 2015. Retrieved 9 February 2015.
- ↑"Election Data 2010". Electoral Calculus. Archived from the original on 26 July 2013. Retrieved 17 October 2015.
- ↑"Election Data 2005". Electoral Calculus. Archived from the original on 15 October 2011. Retrieved 18 October 2015.
- ↑"BBC NEWS | Election 2005 | Results | Stoke-on-Trent North". BBC News.
- ↑"Election Data 2001". Electoral Calculus. Archived from the original on 15 October 2011. Retrieved 18 October 2015.
- ↑"BBC NEWS | VOTE 2001 | RESULTS & CONSTITUENCIES | Stoke-on-Trent North". BBC News.
- ↑"Election Data 1997". Electoral Calculus. Archived from the original on 15 October 2011. Retrieved 18 October 2015.
- ↑"Politics Science Resources". 12 October 2022.
- ↑"Election Data 1992". Electoral Calculus. Archived from the original on 15 October 2011. Retrieved 18 October 2015.
- ↑"Politics Resources". Election 1992. Politics Resources. 9 April 1992. Retrieved 6 December 2010.
- ↑"Election Data 1987". Electoral Calculus. Archived from the original on 15 October 2011. Retrieved 18 October 2015.
- ↑"Election Data 1983". Electoral Calculus. Archived from the original on 15 October 2011. Retrieved 18 October 2015.
External links
- Stoke-on-Trent North UK Parliament constituency (boundaries April 1997 – April 2010) at MapIt UK
- Stoke-on-Trent North UK Parliament constituency (boundaries April 2010 – May 2024) at MapIt UK
- Stoke-on-Trent North UK Parliament constituency (boundaries from June 2024) at MapIt UK
53°04′N2°12′W / 53.07°N 2.20°W / 53.07; -2.20
- Parliamentary constituencies in Staffordshire
- Politics of Stoke-on-Trent
- Constituencies of the Parliament of the United Kingdom established in 1950
- Politics of the Borough of Newcastle-under-Lyme