
Ilford South
Ilford South is a constituency[n 1] created in 1945, and represented in the House of Commons of the UK Parliament since 2024 by Jas Athwal of the Labour Party.[n 2]
Constituency profile
Ilford South is a mostly suburban constituency in Greater London, located around 10 miles (16 km) north-east of the centre of London. It covers the southern part of the town of Ilford, including the town centre and the neighbourhoods of Seven Kings, Newbury Park, Little Heath, Marks Gate and parts of Chadwell Heath. The area was traditionally rural but developed rapidly along with much of suburban London during the early 20th century. Today the constituency is suburban in character, interspersed with parks, and is connected to central London by the Elizabeth and Central lines. The constituency has high levels of deprivation, especially in the centre of Ilford.[2] House prices are higher than the national average but considerably lower than the rest of London.[3]
As of the 2021 census, a majority (58%) of Ilford South residents were ethnically Asian, split between large Indian, Pakistani and Bangladeshi communities. White people made up 22% of residents, just under half of whom are of non-British origin; the constituency has a large Romanian population.[4]Black people made up 11% of residents.[5] The constituency is religiously diverse, with considerably higher proportions of Muslims, Hindus and Sikhs than the rest of the country.[6]
Residents of Ilford South are young and have low levels of education and income compared to the rest of London.[3] Few residents work in scientific and professional occupations, and a high proportion work in healthcare and retail.[7] At the local borough council, all seats within the constituency are represented by Labour Party councillors. An estimated 52% of voters in Ilford South supported remaining in the European Union in the 2016 referendum, higher than the nationwide figure of 48% but lower than the rest of London.[3]
Political history
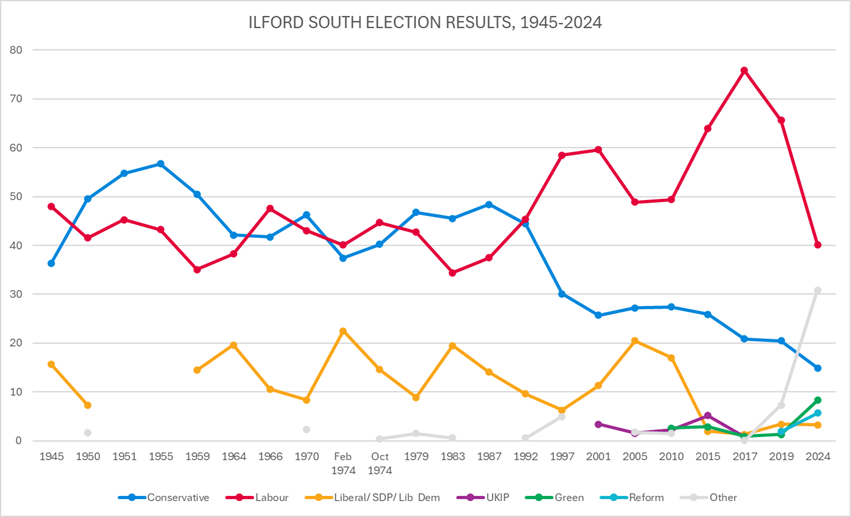
This constituency was created in 1945. The previous MP since 1992, Mike Gapes, who before defecting to Change UK, was the fourth Labour Party MP, each of whose tenures was interspersed or preceded by one of a Conservative MP serving the area. Regarded as a key marginal seat for decades, under Gapes's tenure Ilford South became a very safe seat for the Labour Party; in every election since 1997 it has been won by a majority of over 20% by Labour, and in 2017 they secured over 75% of the vote in the constituency.
The 2015 result made the seat the 38th safest of Labour's 232 seats by percentage of majority.[8] The narrowest result since 1997 (inclusive) was in 2005 at a majority of 21.6%; the 2017 majority is the greatest ever achieved in the seat, at 54.9%.
Boundaries


Historic
1945–1950: The Borough of Ilford wards of Clementswood, Cranbrook, Goodmayes, Loxford, and Park.
1950–1974: The Borough of Ilford wards of Clementswood, Cranbrook, Goodmayes, Loxford, Mayfield, and Park.
1974–1983: The London Borough of Redbridge wards of Clementswood, Cranbrook, Goodmayes, Ilford, Mayfield, and Park.
1983–1997: As above substituting Ilford and Park with reshaped wards Loxford, Newbury, and Valentines.
1997–2017: As above plus Chadwell and Seven Kings wards.
2017–2024: Following a review of ward boundaries which did not effect the parliamentary boundaries, from May 2017 the constituency comprised the following wards:
- Chadwell, Clementswood, Cranbrook, Goodmayes, Ilford Town, Loxford, Mayfield, Newbury, Seven Kings, Valentines, and a small part of Wanstead Park ward.
Current
Further to the 2023 review of Westminster constituencies, which came into effect for the 2024 general election, the constituency is composed of:
- The London Borough of Barking and Dagenham ward of Chadwell Heath; and
- The London Borough of Redbridge wards of Chadwell, Clementswood, Goodmayes, Ilford Town, Loxford, Mayfield, Newbury, and Seven Kings.[9]
- The Cranbrook and Valentines wards were transferred to Ilford North, with the small part of Wanstead Park ward going to Leyton and Wanstead. To partly compensate, the Chadwell Heath ward was transferred from Dagenham and Rainham.
Members of Parliament
Election results
Elections in the 2020s
| Party | Candidate | Votes | % | ±% | |
|---|---|---|---|---|---|
| Labour | Jas Athwal | 16,537 | 40.2 | –25.4 | |
| Independent | Noor Begum | 9,643 | 23.4 | N/A | |
| Conservative | Sayeed Syduzzaman | 6,142 | 14.9 | –5.6 | |
| Green | Syed Siddiqi | 3,437 | 8.3 | +7.0 | |
| Reform | Raj Forhad | 2,329 | 5.7 | +3.8 | |
| Workers Party | Golam Tipu | 1,366 | 3.3 | N/A | |
| Liberal Democrats | Richard Clare | 1,340 | 3.3 | –0.1 | |
| TUSC | Andy Walker | 376 | 0.9 | N/A | |
| Majority | 6,896 | 16.8 | –27.2 | ||
| Turnout | 41,170 | 50.8 | –11.8 | ||
| Registered electors | 80,993 | ||||
| Labourhold | |||||
Elections in the 2010s
| 2019notional result[13] | |||
|---|---|---|---|
| Party | Vote | % | |
| Labour | 30,246 | 65.2 | |
| Conservative | 9,837 | 21.2 | |
| Others | 3,082 | 6.6 | |
| Liberal Democrats | 1,546 | 3.3 | |
| Brexit Party | 1,034 | 2.2 | |
| Green | 623 | 1.3 | |
| Turnout | 46,368 | 62.6 | |
| Electorate | 74,065 | ||
| Party | Candidate | Votes | % | ±% | |
|---|---|---|---|---|---|
| Labour | Sam Tarry | 35,085 | 65.6 | –10.2 | |
| Conservative | Ali Azeem | 10,984 | 20.5 | –0.4 | |
| The Independent Group for Change | Mike Gapes | 3,891 | 7.3 | N/A | |
| Liberal Democrats | Ashburn Holder | 1,795 | 3.4 | +2.1 | |
| Brexit Party | Munish Sharma | 1,008 | 1.9 | N/A | |
| Green | Rosemary Warrington | 714 | 1.3 | +0.4 | |
| Majority | 24,101 | 45.1 | –9.8 | ||
| Turnout | 53,477 | 62.9 | –7.0 | ||
| Labourhold | Swing | –4.9 | |||
| Party | Candidate | Votes | % | ±% | |
|---|---|---|---|---|---|
| Labour Co-op | Mike Gapes | 43,724 | 75.8 | +11.8 | |
| Conservative | Christopher Chapman | 12,077 | 20.9 | –5.0 | |
| Liberal Democrats | Farid Ahmed | 772 | 1.3 | –0.7 | |
| Green | Rosemary Warrington | 542 | 0.9 | –2.0 | |
| UKIP | Tariq Saeed | 477 | 0.8 | –4.4 | |
| Friends Party | Kane Khan | 65 | 0.1 | N/A | |
| Majority | 31,647 | 54.9 | +16.8 | ||
| Turnout | 57,657 | 69.9 | +13.5 | ||
| Registered electors | 82,487 | ||||
| Labour Co-ophold | Swing | +8.4 | |||
| Party | Candidate | Votes | % | ±% | |
|---|---|---|---|---|---|
| Labour Co-op | Mike Gapes[19] | 33,232 | 64.0 | +14.6 | |
| Conservative | Christopher Chapman | 13,455 | 25.9 | −1.5 | |
| UKIP | Amjad Khan[20] | 2,705 | 5.2 | +3.0 | |
| Green | Rosemary Warrington[21] | 1,506 | 2.9 | +0.3 | |
| Liberal Democrats | Ashburn Holder | 1,014 | 2.0 | −15.0 | |
| Majority | 19,777 | 38.1 | +16.1 | ||
| Turnout | 51,912 | 56.4 | −1.6 | ||
| Registered electors | 91,987 | ||||
| Labour Co-ophold | Swing | +8.1 | |||
| Party | Candidate | Votes | % | ±% | |
|---|---|---|---|---|---|
| Labour Co-op | Mike Gapes | 25,311 | 49.4 | +0.5 | |
| Conservative | Toby Boutle | 14,014 | 27.4 | +0.2 | |
| Liberal Democrats | Anood Al-Samerai | 8,679 | 17.0 | −3.5 | |
| Green | Wilson Chowdhry | 1,319 | 2.6 | N/A | |
| UKIP | Terry Murray | 1,132 | 2.2 | +0.6 | |
| Save King George Hospital | John Jestico | 746 | 1.5 | N/A | |
| Majority | 11,297 | 22.0 | +0.3 | ||
| Turnout | 51,201 | 58.0 | +4.4 | ||
| Registered electors | 86,220 | ||||
| Labour Co-ophold | Swing | +0.2 | |||
Elections in the 2000s
| Party | Candidate | Votes | % | ±% | |
|---|---|---|---|---|---|
| Labour Co-op | Mike Gapes | 20,856 | 48.9 | −10.7 | |
| Conservative | Stephen Metcalfe | 11,628 | 27.2 | +1.5 | |
| Liberal Democrats | Matthew E. Lake | 8,761 | 20.5 | +9.2 | |
| British Public Party | Kashif Rana | 763 | 1.8 | N/A | |
| UKIP | Colin H. Taylor | 685 | 1.6 | −1.8 | |
| Majority | 9,228 | 21.7 | −12.2 | ||
| Turnout | 42,693 | 53.6 | −0.7 | ||
| Registered electors | 79,646 | ||||
| Labour Co-ophold | Swing | −6.1 | |||
| Party | Candidate | Votes | % | ±% | |
|---|---|---|---|---|---|
| Labour Co-op | Mike Gapes | 24,619 | 59.6 | +1.1 | |
| Conservative | Suresh Kumar | 10,622 | 25.7 | −4.4 | |
| Liberal Democrats | Ralph Scott | 4,647 | 11.3 | +5.0 | |
| UKIP | Harun Khan | 1,407 | 3.4 | N/A | |
| Majority | 13,997 | 33.9 | +5.5 | ||
| Turnout | 41,295 | 54.3 | −15.9 | ||
| Registered electors | 76,025 | ||||
| Labour Co-ophold | Swing | +2.7 | |||
Elections in the 1990s
| Party | Candidate | Votes | % | ±% | |
|---|---|---|---|---|---|
| Labour Co-op | Mike Gapes | 29,273 | 58.5 | +13.5 | |
| Conservative | Neil Thorne | 15,073 | 30.1 | −14.3 | |
| Liberal Democrats | Aina Khan | 3,152 | 6.3 | −3.3 | |
| Referendum | David Hodges | 1,073 | 2.1 | N/A | |
| Socialist Labour | Bruce G. Ramsey | 868 | 1.7 | N/A | |
| BNP | Aron Owens | 580 | 1.2 | N/A | |
| Majority | 14,200 | 28.4 | +27.4 | ||
| Turnout | 50,019 | 70.2 | −6.5 | ||
| Registered electors | 71,202 | ||||
| Labour Co-ophold | Swing | +16.6 | |||
| Party | Candidate | Votes | % | ±% | |
|---|---|---|---|---|---|
| Labour Co-op | Mike Gapes | 19,418 | 45.4 | +7.9 | |
| Conservative | Neil Thorne | 19,016 | 44.4 | −4.0 | |
| Liberal Democrats | George G. Hogarth | 4,126 | 9.6 | −4.5 | |
| Natural Law | Nandkishore Bramachari | 269 | 0.6 | N/A | |
| Majority | 402 | 1.0 | N/A | ||
| Turnout | 42,829 | 76.7 | +4.9 | ||
| Registered electors | 55,741 | ||||
| Labour Co-opgain from Conservative | Swing | +6.0 | |||
Elections in the 1980s
| Party | Candidate | Votes | % | ±% | |
|---|---|---|---|---|---|
| Conservative | Neil Thorne | 20,351 | 48.4 | +2.9 | |
| Labour | Kenneth Jones | 15,779 | 37.5 | +3.1 | |
| Liberal | Ralph Scott | 5,928 | 14.1 | −5.4 | |
| Majority | 4,572 | 10.9 | −0.2 | ||
| Turnout | 42,058 | 71.8 | +1.2 | ||
| Registered electors | 58,572 | ||||
| Conservativehold | Swing | ||||
| Party | Candidate | Votes | % | ±% | |
|---|---|---|---|---|---|
| Conservative | Neil Thorne | 18,672 | 45.5 | −1.3 | |
| Labour | John Hogben | 14,106 | 34.4 | −8.3 | |
| Liberal | Ralph Scott | 7,999 | 19.5 | +10.6 | |
| BNP | R.A. Martin | 235 | 0.6 | −0.9 | |
| Majority | 4,566 | 11.1 | +7.0 | ||
| Turnout | 41,012 | 70.6 | −5.3 | ||
| Registered electors | 58,208 | ||||
| Conservativehold | Swing | ||||
Elections in the 1970s
| Party | Candidate | Votes | % | ±% | |
|---|---|---|---|---|---|
| Conservative | Neil Thorne | 19,290 | 46.8 | +6.6 | |
| Labour | Arnold Shaw | 17,602 | 42.7 | −2.0 | |
| Liberal | Ralph Scott | 3,664 | 8.9 | −5.72 | |
| National Front | Terence Fitzgerald[24] | 636 | 1.5 | N/A | |
| Majority | 1,688 | 4.1 | N/A | ||
| Turnout | 39,230 | 75.9 | +6.17 | ||
| Registered electors | 54,295 | ||||
| Conservativegain from Labour | Swing | ||||
| Party | Candidate | Votes | % | ±% | |
|---|---|---|---|---|---|
| Labour | Arnold Shaw | 17,538 | 44.71 | +4.64 | |
| Conservative | Neil Thorne | 15,789 | 40.25 | +2.84 | |
| Liberal | E. Yates | 5,734 | 14.62 | −7.90 | |
| More Prosperous Britain | Tom Keen | 169 | 0.43 | N/A | |
| Majority | 1,749 | 4.46 | +1.80 | ||
| Turnout | 39,230 | 69.73 | −7.20 | ||
| Registered electors | 56,257 | ||||
| Labourhold | Swing | ||||
| Party | Candidate | Votes | % | ±% | |
|---|---|---|---|---|---|
| Labour | Arnold Shaw | 17,201 | 40.07 | −2.96 | |
| Conservative | Albert Cooper | 16,058 | 37.41 | −8.84 | |
| Liberal | Gareth Wilson | 9,666 | 22.52 | +14.11 | |
| Majority | 1,143 | 2.66 | N/A | ||
| Turnout | 42,925 | 76.93 | +8.8 | ||
| Registered electors | 55,799 | ||||
| Labourgain from Conservative | Swing | ||||
| Party | Candidate | Votes | % | ±% | |
|---|---|---|---|---|---|
| Conservative | Albert Cooper | 18,369 | 46.25 | +4.48 | |
| Labour | Arnold Shaw | 17,087 | 43.03 | −4.56 | |
| Liberal | Gerald Leslie Wilson | 3,341 | 8.41 | −2.22 | |
| National Front | Malcolm Eric Leslie Skeggs | 727 | 1.83 | N/A | |
| Independent | Michael Joseph Marks | 190 | 0.48 | N/A | |
| Majority | 1,282 | 3.22 | N/A | ||
| Turnout | 39,714 | 68.13 | −8.80 | ||
| Registered electors | 58,292 | ||||
| Conservativegain from Labour | Swing | ||||
Elections in the 1960s
| Party | Candidate | Votes | % | ±% | |
|---|---|---|---|---|---|
| Labour | Arnold Shaw | 20,613 | 47.59 | +9.52 | |
| Conservative | Albert Cooper | 18,093 | 41.77 | −0.36 | |
| Liberal | Irene Watson | 4,606 | 10.63 | −8.99 | |
| Majority | 2,520 | 5.82 | N/A | ||
| Turnout | 43,312 | 76.93 | +1.92 | ||
| Registered electors | 56,302 | ||||
| Labourgain from Conservative | Swing | ||||
| Party | Candidate | Votes | % | ±% | |
|---|---|---|---|---|---|
| Conservative | Albert Cooper | 18,352 | 42.13 | −8.37 | |
| Labour | Arnold Shaw | 16,659 | 38.25 | +3.20 | |
| Liberal | Peter McGregor | 8,547 | 19.62 | +5.17 | |
| Majority | 1,693 | 3.88 | −11.57 | ||
| Turnout | 43,558 | 75.01 | −2.90 | ||
| Registered electors | 58,066 | ||||
| Conservativehold | Swing | ||||
Elections in the 1950s
| Party | Candidate | Votes | % | ±% | |
|---|---|---|---|---|---|
| Conservative | Albert Cooper | 23,876 | 50.50 | −6.23 | |
| Labour | Gordon Borrie | 16,569 | 35.05 | −8.22 | |
| Liberal | Raymond V Netherclift | 6,832 | 14.45 | N/A | |
| Majority | 7,307 | 15.45 | +1.99 | ||
| Turnout | 47,277 | 77.91 | +2.59 | ||
| Registered electors | 60,678 | ||||
| Conservativehold | Swing | ||||
| Party | Candidate | Votes | % | ±% | |
|---|---|---|---|---|---|
| Conservative | Albert Cooper | 27,292 | 56.73 | +1.98 | |
| Labour | James Ranger | 20,814 | 43.27 | −1.98 | |
| Majority | 6,478 | 13.46 | +3.96 | ||
| Turnout | 48,106 | 75.32 | −7.34 | ||
| Registered electors | 63,866 | ||||
| Conservativehold | Swing | ||||
| Party | Candidate | Votes | % | ±% | |
|---|---|---|---|---|---|
| Conservative | Albert Cooper | 30,177 | 54.75 | +5.24 | |
| Labour | James Ranger | 24,938 | 45.25 | +3.72 | |
| Majority | 5,239 | 9.50 | +1.52 | ||
| Turnout | 54,115 | 82.66 | −2.71 | ||
| Registered electors | 66,678 | ||||
| Conservativehold | Swing | ||||
| Party | Candidate | Votes | % | ±% | |
|---|---|---|---|---|---|
| Conservative | Albert Cooper | 28,087 | 49.51 | +13.21 | |
| Labour | James Ranger | 23,558 | 41.53 | −6.47 | |
| Liberal | Ronald Acott Hall | 4,170 | 7.35 | −8.35 | |
| Communist | Dave Kelly[25] | 913 | 1.61 | N/A | |
| Majority | 4,529 | 7.98 | N/A | ||
| Turnout | 56,728 | 85.37 | +14.27 | ||
| Registered electors | 66,720 | ||||
| Conservativegain from Labour | Swing | ||||
Elections in the 1940s
| Party | Candidate | Votes | % | ±% | |
|---|---|---|---|---|---|
| Labour | James Ranger | 19,339 | 48.0 | ||
| Conservative | Edward Boulton | 14,633 | 36.3 | ||
| Liberal | Eric Arthur Holloway | 6,322 | 15.7 | ||
| Majority | 4,706 | 11.7 | |||
| Turnout | 40,294 | 71.1 | |||
| Registered electors | 56,669 | ||||
| Labourwin (new seat) | |||||
See also
Notes
- ↑A borough constituency (for the purposes of election expenses and type of returning officer)
- ↑As with all constituencies, the constituency elects one Member of Parliament (MP) by the first past the post system of election at least every five years.
References
- ↑"The 2023 Review of Parliamentary Constituency Boundaries in England – Volume two: Constituency names, designations and composition – London". Boundary Commission for England. Retrieved 21 June 2024.
- ↑"Constituency data: Deprivation in England". commonslibrary.parliament.uk. Retrieved 4 December 2025.
- 123"Seat Details - Ilford South". electoralcalculus.co.uk. Retrieved 24 March 2026.
- ↑"Country of birth - Census Maps, ONS". ons.gov.uk. Retrieved 24 March 2026.
- ↑"2021 census results: Ethnic groups in your constituency". commonslibrary.parliament.uk. 4 July 2024. Retrieved 19 November 2025.
- ↑"2021 census results: Religion in your constituency". commonslibrary.parliament.uk. Retrieved 21 November 2025.
- ↑"Constituency data: businesses and industries". commonslibrary.parliament.uk. Retrieved 1 March 2026.
- ↑"Labour Members of Parliament 2015". UK Political.info. Archived from the original on 29 September 2018.
- ↑"The Parliamentary Constituencies Order 2023". Schedule 1 Part 3 London region.
- ↑Leigh Rayment's Historical List of MPs – Constituencies beginning with "I"
- ↑"STATEMENT OF PERSONS NOMINATED, NOTICE OF POLL AND SITUATION OF POLLING STATIONS"(PDF). Redbridge Council. Retrieved 9 June 2024.
- ↑"Ilford South – General election results 2024". BBC News. Retrieved 10 December 2024.
- ↑"Notional results for a UK general election on 12 December 2019". Rallings & Thrasher, Professor David Denver (Scotland), Nicholas Whyte (NI) for Sky News, PA, BBC News and ITV News. UK Parliament. Retrieved 11 July 2024.
- ↑"Ilford South Parliamentary constituency". BBC News. BBC. Retrieved 23 November 2019.
- ↑Statement of Persons Nominated and Notice of PollArchived 15 June 2020 at the Wayback Machine London Borough of Redbridge
- ↑"Ilford South parliamentary constituency". BBC News.
- ↑"General Election 2017: results and analysis"(PDF). House of Commons Library. Retrieved 22 July 2021.
- ↑"Election Data 2015". Electoral Calculus. Archived from the original on 17 October 2015. Retrieved 17 October 2015.
- ↑"UK ELECTION RESULTS: ILFORD SOUTH 2015".
- ↑"Election 2015 – Ilford Recorder". Archived from the original on 15 April 2015. Retrieved 25 April 2015.
- ↑"Prospective General Election Candidates | Green Party". Green Party Members' Website.
- ↑"General Election Results from the Electoral Commission".
- ↑"Archived copy". Archived from the original on 16 July 2011. Retrieved 2 May 2010.
{{cite web}}: CS1 maint: archived copy as title (link) - ↑Election Expenses. Parliament of the United Kingdom. 1980. p. 19. ISBN 0102374805.
- ↑Stevenson, Graham. "Dave Kelly". Archived from the original on 23 April 2017. Retrieved 23 April 2017.
External links
- Politics Resources (Election results from 1922 onwards)
- Electoral Calculus (Election results from 1955 onwards)
- Ilford South UK Parliament constituency (boundaries April 1997 – April 2010) at MapIt UK
- Ilford South UK Parliament constituency (boundaries April 2010 – May 2024) at MapIt UK
- Ilford South UK Parliament constituency (boundaries from June 2024) at MapIt UK
51°33′50″N0°05′10″E / 51.564°N 0.086°E / 51.564; 0.086
- Politics of the London Borough of Redbridge
- Parliamentary constituencies in London
- Constituencies of the Parliament of the United Kingdom established in 1945
- Ilford