
استجابة التردد
في معالجة الإشارات والإلكترونيات ، يُعدّ استجابة التردد لنظام ما مقياسًا كميًا لسعة وطور الإشارة الخارجة كدالة لتردد الإشارة الداخلة. [ 1 ] تُستخدم استجابة التردد على نطاق واسع في تصميم وتحليل الأنظمة، مثل أجهزة الصوت وأنظمة التحكم ، حيث تُبسّط التحليل الرياضي بتحويل المعادلات التفاضلية الحاكمة إلى معادلات جبرية . في نظام الصوت، يُمكن استخدامها لتقليل التشوه المسموع عن طريق تصميم المكونات (مثل الميكروفونات ومكبرات الصوت ومكبرات الصوت ) بحيث تكون الاستجابة الكلية مسطحة (موحدة) قدر الإمكان عبر نطاق تردد النظام . في أنظمة التحكم، مثل نظام تثبيت السرعة في السيارة ، يُمكن استخدامها لتقييم استقرار النظام ، غالبًا باستخدام مخططات بود . يُمكن تصميم الأنظمة ذات استجابة تردد محددة باستخدام مرشحات تناظرية ورقمية .
يُحدد استجابة التردد خصائص الأنظمة في مجال التردد ، تمامًا كما تُحدد استجابة النبضة خصائص الأنظمة في مجال الزمن . في الأنظمة الخطية (أو كتقريب لنظام حقيقي، مع إهمال الخصائص غير الخطية من الدرجة الثانية)، يصف أي من الاستجابتين النظام وصفًا كاملًا، وبالتالي توجد مطابقة تامة: استجابة التردد هي تحويل فورييه لاستجابة النبضة. تُتيح استجابة التردد تحليلًا أبسط للأنظمة المتتالية مثل مكبرات الصوت متعددة المراحل ، حيث يمكن إيجاد استجابة النظام الكلية من خلال ضرب استجابات التردد للمراحل الفردية (بدلًا من التفاف استجابة النبضة في مجال الزمن). ترتبط استجابة التردد ارتباطًا وثيقًا بدالة النقل في الأنظمة الخطية، وهي تحويل لابلاس لاستجابة النبضة. وهما متكافئتان عندما يكون الجزء الحقيقيللمتغير المركب لدالة التحويليساوي صفرًا. [ 2 ]


القياس والرسم
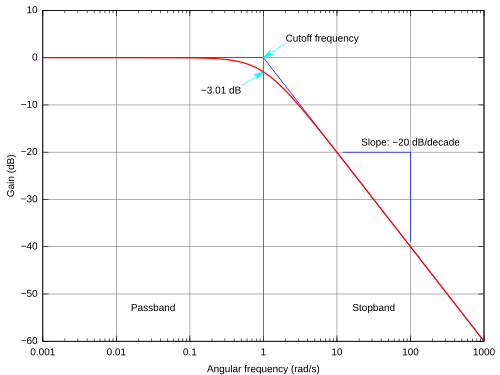
Measuring the frequency response typically involves exciting the system with an input signal and measuring the resulting output signal, calculating the frequency spectra of the two signals (for example, using the fast Fourier transform for discrete signals), and comparing the spectra to isolate the effect of the system. In linear systems, the frequency range of the input signal should cover the frequency range of interest.
Several methods using different input signals may be used to measure the frequency response of a system, including:
- Applying constant amplitude sinusoids stepped through a range of frequencies and comparing the amplitude and phase shift of the output relative to the input. The frequency sweep must be slow enough for the system to reach its steady-state at each point of interest
- Applying an impulse signal and taking the Fourier transform of the system's response
- Applying a wide-sense stationarywhite noise signal over a long period of time and taking the Fourier transform of the system's response. With this method, the cross-spectral density (rather than the power spectral density) should be used if phase information is required
The frequency response is characterized by the magnitude, typically in decibels (dB) or as a generic amplitude of the dependent variable, and the phase, in radians or degrees, measured against frequency, in radian/s, Hertz (Hz) or as a fraction of the sampling frequency.
There are three common ways of plotting response measurements:
- Bode plots graph magnitude and phase against frequency on two rectangular plots
- Nyquist plots graph magnitude and phase parametrically against frequency in polar form
- Nichols plots graph magnitude and phase parametrically against frequency in rectangular form
For the design of control systems, any of the three types of plots may be used to infer closed-loop stability and stability margins from the open-loop frequency response. In many frequency domain applications, the phase response is relatively unimportant, and the magnitude response of the Bode plot may be all that is required. In digital systems (such as digital filters), the frequency response often contains a main lobe with multiple periodic sidelobes, due to spectral leakage caused by digital processes such as sampling and windowing.[3]
Applications
في نطاق الترددات المسموعة، يُشار عادةً إلى استجابة التردد فيما يتعلق بمضخمات الصوت الإلكترونية والميكروفونات ومكبرات الصوت . أما استجابة تردد الطيف الراديوي فتشمل قياسات الكابلات المحورية ، وكابلات الأزواج الملتوية ، ومعدات تحويل الفيديو ، وأجهزة الاتصالات اللاسلكية ، وأنظمة الهوائيات. وتشمل قياسات استجابة التردد تحت الصوتي الزلازل وتخطيط كهربية الدماغ (موجات الدماغ).
تُستخدم منحنيات استجابة التردد غالبًا للإشارة إلى دقة المكونات أو الأنظمة الإلكترونية. [ 4 ] عندما يُعيد نظام أو مكون إنتاج جميع إشارات الإدخال المطلوبة دون أي تضخيم أو إضعاف لنطاق تردد معين، يُقال إن النظام أو المكون "مستوٍ"، أو أن منحنى استجابة التردد لديه مسطح. [ 4 ] في حالات أخرى، تُستخدم أحيانًا رسوم بيانية ثلاثية الأبعاد لاستجابة التردد.
تختلف متطلبات استجابة التردد باختلاف التطبيق. [ 5 ] في أنظمة الصوت عالية الدقة ، يتطلب المضخم استجابة تردد مسطحة لا تقل عن 20-20000 هرتز، مع هامش خطأ يصل إلى ±0.1 ديسيبل في نطاق الترددات المتوسطة حول 1000 هرتز؛ أما في أنظمة الهاتف ، فتكفي استجابة تردد تتراوح بين 400 و4000 هرتز، مع هامش خطأ ±1 ديسيبل، لضمان وضوح الكلام. [ 5 ]
بمجرد قياس استجابة التردد (مثل استجابة النبضة)، وبشرط أن يكون النظام خطيًا وثابتًا مع الزمن ، يمكن تقريب خصائصه بدقة عالية باستخدام مرشح رقمي . وبالمثل، إذا ثبت أن النظام يعاني من ضعف في استجابة التردد، فيمكن تطبيق مرشح رقمي أو تناظري على الإشارات قبل إعادة إنتاجها للتعويض عن هذا القصور.
يُعد شكل منحنى استجابة التردد مهمًا جدًا للحماية من التشويش للرادارات والاتصالات والأنظمة الأخرى.
يمكن أيضًا تطبيق تحليل استجابة التردد على المجالات البيولوجية، مثل الكشف عن ظاهرة التنشيط الهرموني في السلوكيات المتكررة ذات ديناميكيات العمليات المتضادة، [ 6 ] أو في تحسين أنظمة العلاج الدوائي. [ 7 ]
انظر أيضاً
مراجع
- ملحوظات
- ↑Smith, Steven W. (1997). The Scientist and Engineer's Guide to Digital Signal Processing. California Technical Pub. pp. 177–180. ISBN 978-0966017632.
- ↑Dennis L. Feucht (1990). Handbook of Analog Circuit Design. Elsevier Science. p. 192. ISBN 978-1-4832-5938-3.
- ↑L. R. Rabiner and B. Gold. Theory and Application of Digital Signal Processing. – Englewood Cliffs, NJ: Prentice-Hall, 1975. – 720 pp
- 12Stark, 2002, p. 51.
- 12Luther, 1999, p. 141.
- ↑Henry, N.; Pedersen, M.; Williams, M.; Donkin, L. (2023-07-03). "Behavioral Posology: A Novel Paradigm for Modeling the Healthy Limits of Behaviors". Advanced Theory and Simulations. 6 (9). doi:10.1002/adts.202300214. hdl:10292/16436. ISSN 2513-0390.
- ↑Schulthess, Pascal; Post, Teun M.; Yates, James; van der Graaf, Piet H. (February 2018). "Frequency-Domain Response Analysis for Quantitative Systems Pharmacology Models: Frequency-domain response analysis for QSP models". CPT: Pharmacometrics & Systems Pharmacology. 7 (2): 111–123. doi:10.1002/psp4.12266. PMC 5824121. PMID 29193852.
- Bibliography
- Luther, Arch C.; Inglis, Andrew F. Video engineering, McGraw-Hill, 1999. ISBN 0-07-135017-9
- Stark, Scott Hunter. Live Sound Reinforcement, Vallejo, California, Artistpro.com, 1996–2002. ISBN 0-918371-07-4
- L. R. Rabiner and B. Gold. Theory and Application of Digital Signal Processing. – Englewood Cliffs, NJ: Prentice-Hall, 1975. – 720 pp
External links
- University of Michigan: Frequency Response Analysis and Design TutorialArchived 2012-10-17 at the Wayback Machine
- Smith, Julius O. III: Introduction to Digital Filters with Audio Applications has a nice chapter on Frequency Response
- Signal processing
- Control theory
- Audio amplifier specifications