
مطياف الكتلة
مطيافية الكتلة ( MS ) هي تقنية تحليلية تُستخدم لقياس نسبة الكتلة إلى الشحنة للأيونات . تُعرض النتائج على شكل طيف كتلي ، وهو رسم بياني يوضح العلاقة بين شدة الإشارة ونسبة الكتلة إلى الشحنة. تُستخدم هذه الأطياف لتحديد البصمة العنصرية أو النظائرية للعينة، وكتل الجسيمات والجزيئات ، ولتوضيح الهوية الكيميائية أو بنية الجزيئات والمركبات الكيميائية الأخرى . تُستخدم مطيافية الكتلة في العديد من المجالات المختلفة، وتُطبق على العينات النقية وكذلك المخاليط المعقدة.
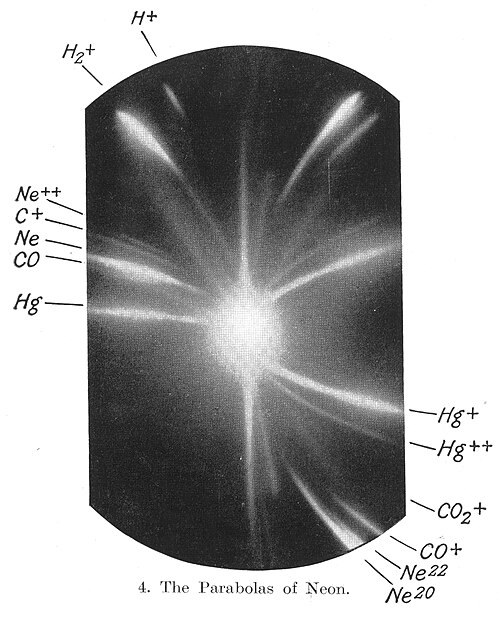
في إجراء مطياف الكتلة النموذجي، تُؤيَّن عينة، قد تكون صلبة أو سائلة أو غازية، على سبيل المثال بقذفها بحزمة من الإلكترونات . قد يؤدي ذلك إلى تفكك بعض جزيئات العينة إلى شظايا موجبة الشحنة، أو ببساطة اكتسابها شحنة موجبة دون تفكك. تُفصل هذه الأيونات (الشظايا) بعد ذلك وفقًا لنسبة كتلتها إلى شحنتها، على سبيل المثال بتسريعها وتعريضها لمجال كهربائي أو مغناطيسي: ستخضع الأيونات ذات النسبة نفسها من الكتلة إلى الشحنة لنفس مقدار الانحراف. [ 1 ] تُكشف الأيونات بواسطة آلية قادرة على كشف الجسيمات المشحونة، مثل مضاعف الإلكترونات . تُعرض النتائج على شكل أطياف لشدة إشارة الأيونات المكتشفة كدالة لنسبة الكتلة إلى الشحنة. يمكن تحديد الذرات أو الجزيئات في العينة من خلال ربط الكتل المعروفة (مثل جزيء كامل) بالكتل المحددة، أو من خلال نمط تفكك مميز.
تاريخ
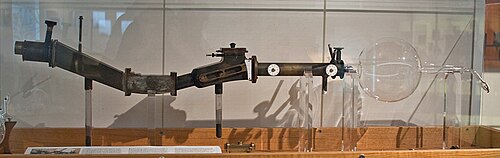
في عام 1886، لاحظ يوجين غولدشتاين أشعةً في تفريغات الغاز تحت ضغط منخفض، تنتقل بعيدًا عن المصعد وعبر قنوات في مهبط مثقب ، في اتجاه معاكس لاتجاه أشعة المهبط سالبة الشحنة (التي تنتقل من المهبط إلى المصعد). أطلق غولدشتاين على هذه الأشعة الموجبة الشحنة اسم "Kanalstrahlen"؛ والترجمة الشائعة لهذا المصطلح إلى الإنجليزية هي " أشعة القناة ". اكتشف فيلهلم فين أن المجالات الكهربائية أو المغناطيسية القوية تحرف أشعة القناة، وفي عام 1899، صنع جهازًا بمجالات كهربائية ومغناطيسية متعامدة يفصل الأشعة الموجبة وفقًا لنسبة الشحنة إلى الكتلة ( Q/m ). وجد فين أن نسبة الشحنة إلى الكتلة تعتمد على طبيعة الغاز في أنبوب التفريغ. لاحقًا، طوّر العالم الإنجليزي جيه جيه طومسون عمل فين عن طريق خفض الضغط لإنشاء مطياف الكتلة.
بحلول عام ١٨٨٤، أصبح مصطلح "المطياف" جزءًا من المصطلحات العلمية الدولية. [ ٢ ] [ ٣ ] كانت أجهزة قياس الطيف المبكرة التي تقيس نسبة الكتلة إلى الشحنة للأيونات تُسمى مطيافات الكتلة ، وهي عبارة عن أجهزة تسجل طيفًا من قيم الكتلة على لوحة فوتوغرافية . [ ٤ ] [ ٥ ] يُشبه مطياف الكتلة مطياف الكتلة، إلا أن حزمة الأيونات تُوجه فيه إلى شاشة فسفورية . [ ٦ ] استُخدم تكوين مطياف الكتلة في الأجهزة المبكرة عندما كان يُراد ملاحظة تأثيرات التعديلات بسرعة. بمجرد ضبط الجهاز بشكل صحيح، تُوضع لوحة فوتوغرافية وتُعرَّض للضوء. استمر استخدام مصطلح "مطياف الكتلة" حتى بعد استبدال الإضاءة المباشرة للشاشة الفسفورية بالقياسات غير المباشرة باستخدام راسم الإشارة . [ ٧ ] يُنصح الآن بتجنب استخدام مصطلح "مطيافية الكتلة" نظرًا لاحتمالية الخلط بينه وبين مطيافية الضوء . [ 1 ] [ 8 ] غالبًا ما يتم اختصار قياس الطيف الكتلي إلى mass-spec أو ببساطة MS . [ 1 ]
تم ابتكار التقنيات الحديثة لقياس الطيف الكتلي بواسطة آرثر جيفري ديمبستر وإف دبليو أستون في عامي 1918 و1919 على التوالي.
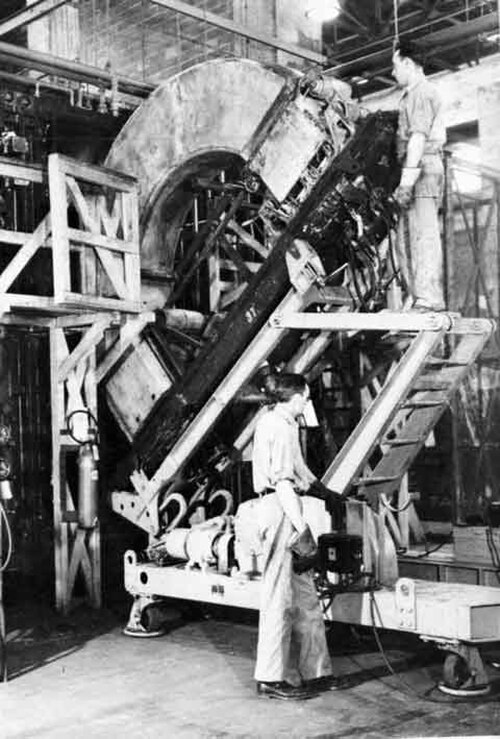
طُوِّرت مطيافات الكتلة القطاعية المعروفة باسم الكالوترونات بواسطة إرنست أو. لورانس ، واستُخدمت لفصل نظائر اليورانيوم خلال مشروع مانهاتن . [ 9 ] استُخدمت مطيافات الكتلة الكالوترونية لتخصيب اليورانيوم في محطة Y-12 في أوك ريدج، تينيسي، التي أُنشئت خلال الحرب العالمية الثانية.
في عام 1989، مُنح نصف جائزة نوبل في الفيزياء لهانز ديهملت وولفجانج بول لتطويرهما تقنية مصيدة الأيونات في الخمسينيات والستينيات من القرن العشرين.
In 2002, the Nobel Prize in Chemistry was awarded to John Bennett Fenn for the development of electrospray ionization (ESI) and Koichi Tanaka for the development of soft laser desorption and their application to the ionization of biological macromolecules, especially proteins.[10]
Components
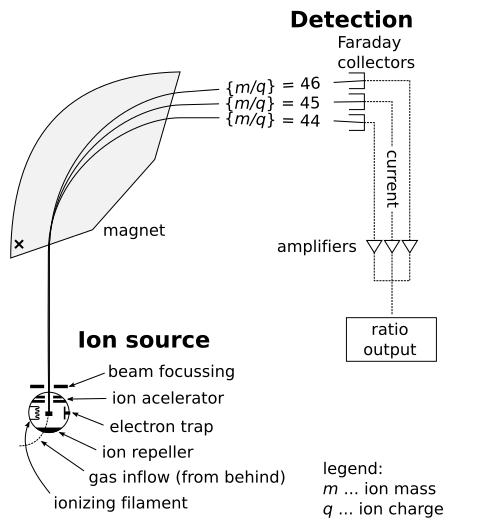
A mass spectrometer consists of 5 components: sample inlet, ion source (or ionizer), mass analyzer, detector, data system. Each component can be varied somewhat independently from the other components, and the full mass spectrometer itself can be included as a component in an analysis pipeline, allowing great flexibility.
The sample inlet prepares the sample to be analyzed in a suitable state.
The ion source takes samples from the sample inlet, converts a portion of the sample into a stream of ions, and outputs it to the mass analyzer. There is a wide variety of ionization techniques, depending on the phase (solid, liquid, gas) of the sample and the efficiency of various ionization mechanisms for the unknown species. An extraction system removes ions from the sample, which are then targeted into the mass analyzer.
The mass analyzer takes an input stream of ions and separates ("analyzes") its constituent ions according to their m/z, the mass-to-charge ratio.
The detector measures the value of an indicator quantity and thus provides data for calculating the abundances of each ion present. Some detectors also give spatial information, e.g., a multichannel plate.
Illustrative example
The following describes the operation of a simple mass spectrometer that uses sector type. Other types are treated below.
Consider a sample of sodium chloride (table salt). In the ion source, the sample is vaporized (turned into gas) and ionized (transformed into electrically charged particles) into sodium (Na+) and chloride (Cl−) ions.
Sodium atoms and ions are monoisotopic, with a mass of about 23 daltons (symbol: Da or older symbol: u). Chloride atoms and ions come in two stable isotopes with masses of approximately 35 u (at a natural abundance of about 75 percent) and approximately 37 u (at a natural abundance of about 25 percent).
The analyzer part of the spectrometer contains electric and magnetic fields, which exert forces on ions traveling through these fields. The speed of a charged particle may be increased or decreased while passing through the electric field, and its direction may be altered by the magnetic field.
The magnitude of the deflection of the moving ion's trajectory depends on its mass-to-charge ratio. Lighter ions are deflected by the magnetic force to a greater degree than heavier ions (based on Newton's second law of motion, F = ma).
The streams of magnetically sorted ions pass from the analyzer to the detector, which records the relative abundance of each ion type. This information is used to determine the chemical element composition of the original sample (i.e. that both sodium and chlorine are present in the sample) and the isotopic composition of its constituents (the ratio of 35Cl to 37Cl).
Sample inlet
The sample inlet provides a stream of neutral molecules, so that the ion source can ionize them. There are several classes.[11]:Ch. 3.2
The classical design produces the stream of molecules in the form of a low-pressure gas. It is low-pressure, so that molecules within the stream do not frequently collide with each other. Ions must travel without frequent collisions, because the instrument separates ions by their motion in electric and magnetic fields. Collisions disturb that motion.
Despite being low-pressure, the sample stream is still at a much higher pressure than the rest of the system, which is held in a greater vacuum. Consequently, the sample stream can only enter the ion source chamber via a small pinhole, called a molecular leak.
If the sample itself is already a gas, then the sample inlet can simply be a gas inlet with pressure valve. If the sample is a volatile liquid or solid, then it can simply be placed in a chamber, vacuum-pumped to a low pressure. If the sample is not sufficiently volatile, the sample inlet can be fitted within an oven. Be careful not to decompose the sample.
If the sample is too nonvolatile to be turned into a low-pressure gas, then one can use a direct probe. The direct probe is a probe with a tip of thin wire loop, pin, or a capillary tube. The sample is placed in the tip. The probe is inserted through a vacuum lock into the ionization chamber, so that the tip is close to the ion source. The probe can be heated to increase vapor pressure further. Such a system is effective for samples with vapor pressures lower than mmHg at room temperature.

The sample can be prepared by an earlier analyzer. For example, it can simply be the gaseous output of a gas chromatography machine as in GC-MS, or the liquid output of a high-performance liquid chromatography machine, as in HPLC-MS.
The recently developed "atmospheric pressure ionization" techniques allow us to entirely dispense with the sample inlet.
Ion source
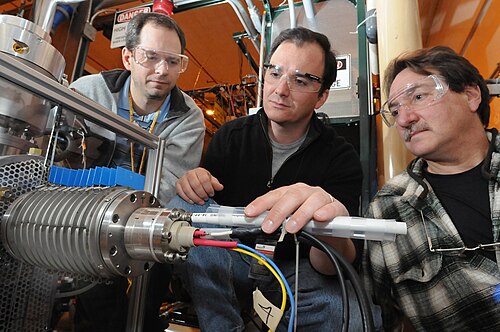
The ion source is the part of the mass spectrometer that transforms the sample from the sample inlet into a stream of ions. There are many techniques with various dimensions for tradeoffs between different choices of ion sources, in terms of monetary cost, accuracy, precision, compatibility with other stages of spectroscopy, ease of use, etc.
For example, electron ionization (EI) gives a high degree of fragmentation, yielding highly detailed mass spectra which when skilfully analysed can provide important information for structural elucidation/characterisation and facilitate identification of unknown compounds by comparison to mass spectral libraries obtained under identical operating conditions. However, EI is not suitable for coupling to HPLC, i.e. LC-MS, since at atmospheric pressure, the filaments used to generate electrons burn out rapidly. Thus EI is coupled predominantly with GC, i.e. GC-MS, where the entire system is under high vacuum.
Two techniques often used with liquid and solid biological samples include electrospray ionization (invented by John Fenn[12]) and matrix-assisted laser desorption/ionization (MALDI, initially developed as a similar technique Soft Laser Desorption) by K. Tanaka[13] for which a Nobel Prize was awarded and as MALDI by M. Karas and F. Hillenkamp[14]).
Hard ionization and soft ionization
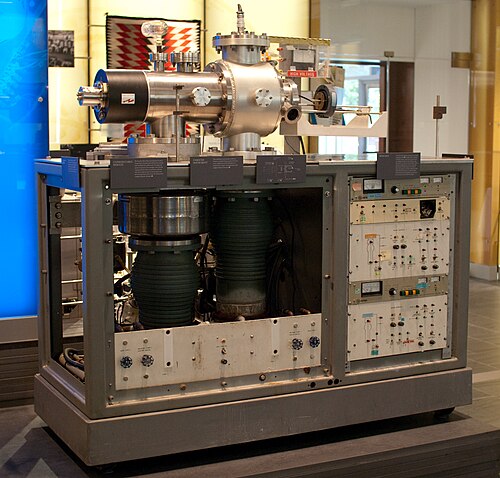
Hard ionization techniques are those that impart high quantities of residual internal energy in the subject molecule, even after ionization. Part of the energy would be dissipated by rupturing chemical bonds within the ion, producing many fragmentary radicalions. The resultant ions tend to have m/z lower than the molecular ion (other than in the case of proton transfer and not including isotope peaks). The most common example of hard ionization is electron ionization (EI).
The radical ions produced after the first ionization are called second-generation product ions. The products are then directed towards the mass analyzer by a repeller electrode. The ionization process often follows predictable cleavage reactions that give rise to fragment ions which, following detection and signal processing, convey structural information about the analyte.
Conversely, soft ionization techniques are those that impart little residual energy onto the subject molecule and as such result in little fragmentation. Examples include fast atom bombardment (FAB), chemical ionization (CI), atmospheric-pressure chemical ionization (APCI), atmospheric-pressure photoionization (APPI), electrospray ionization (ESI), desorption electrospray ionization (DESI), and matrix-assisted laser desorption/ionization (MALDI).
Electron ionization
In electron ionization (EI), energetic electrons are produced by a hot cathode: a wire filament heated by running electric current through it, producing energetic electrons by thermionic emission. The electrons are then accelerated towards an anode. The voltage difference between the cathode and the anode determines the energy of the electron stream.[11]:Ch. 3.3
Most organic compounds have ionization energy 8-15 eV, but empirically, the efficiency of ionization is too low unless the electron beam has an energy of 50-70 eV per electron. The spectral features, including fragmentation patterns, depend on the energy setting. Conventionally for EI, the electron energy is standardized to be exactly 70 eV. Consequently, if one wishes to compare their EI-MS results against standard databases, or produce results that can be added to standard databases, one must standardize their EI electron energy to 70 eV.[11]:Ch. 3.3
EI accepts as input a stream of gas from the molecular leak. The gas stream crosses the electron stream perpendicularly. The collision ionizes the gas stream. The ion stream then is accerelated by a succession of electrodes. Typically an ion carrying 1 e would be accelerated to 1-10 keV.[11]:Ch. 3.3
EI has many benefits for routine mass spectrometry of small organic molecules. It is cheap and robust, with reproducible spectrograms. Databases for EI spectrograms are widely available and covers many such molecules.[11]:Ch. 3.3
EI is unsuited for large molecules, such as most biomolecules. It is a hard technique, which tends to break down large molecule ions during flight, since large molecules are particularly easy to fragment. Furthermore, large molecules are hard to volatilize without being degraded by heat.[11]:Ch. 3.3
Chemical ionization
In chemical ionization (CI), the analyte is ionized by a chemical reaction with an ionized reagent gas (itself ionized by some technique, such as by EI). The analyte gas and the reagent gas intersect, and react. The reaction then produces ionized analyte fragments by various mechanisms, including proton transfer, electron transfer, and adduct formation. The ion is then accelerated electrostatically, as in EI. CI ion sources are similar to EI sources, and most modern mass spectrometers can switch from EI to CI mode in minutes.[11]:Ch. 3.3
To ensure efficiency, the amount of reagent is much higher than the analyte. Consequently, a large amount of reagent ions would end up in the mass analyzer. This is usually handled by only measuring the part of the spectrogram with m/z above those of the main species in the reagent ion stream.[11]:Ch. 3.3
Common ionizing reagents for CI-MS include methane, ammonia, isobutane, and methanol. The proton affinity of the reagent gas and of the sample should be matched to ensure efficient ionization. If the proton affinity of the reagent gas is too high, ionization is inefficient. If the proton affinity of the reagent gas is too low, fragmentation is excessive.[11]:Ch. 3.3
For example:[11]:Ch. 3.3
- When the reagent is methane, the predominant reaction is proton transfer M + CH5+ → (MH)+ + CH4.
- When the reagent is ammonium, the predominant reaction is proton transfer M + NH4+ → (MH)+ + NH3.
- When the reagent is isobutane, the reaction may be proton transfer M + (CH3)3C+ → (MH)+ + (CH3)2C=CH2 or adduct formation M + (CH3)3C+ → (M · C(CH3)3)+.
- CI can also produce negatively charged analyte ions by proton abstraction or adduct formation. For example, ionized NF3 contains F−, which abstracts proton.
| Reagent gas | Proton affinity (kcal/mole) | Reagent ion(s) | Analyte ion(s) | Comments |
|---|---|---|---|---|
| H2 | 101 | H+3 | (MH)+ | Significant fragmentation |
| CH4 | 132 | CH+5, C2H+5 | (MH)+, (M · C2H5)+ | Some fragmentation, can form adducts |
| NH3 | 204 | NH+4 | (MH)+, (M · NH4)+ | Selective ionization, little fragmentation, can form adducts |
| (CH3)3CH | 196 | (CH3)3C+ | (MH)+, (M · C(CH3)3)+ | Selective protonation, little fragmentation. |
| CH3OH | 182 | CH3OH+2 | (MH)+ | |
| CH3CN | 188 | CH3CNH+ | (MH)+ |
Spray ionization
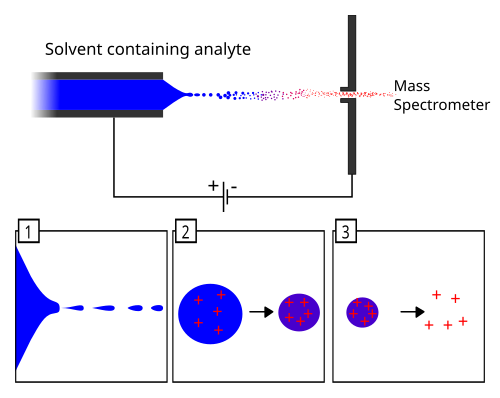
يُعدّ التأين بالرذاذ الكهربائي (ESI) والتأين بالرذاذ الحراري (TSI) مناسبين للجزيئات الحيوية ذات الوزن الجزيئي العالي والمركبات الأخرى غير المستقرة أو غير المتطايرة، وخاصةً في نظام LC-MS. في كلتا الحالتين، يكون المُحلَّل في محلول. يُرشّ المحلول، إما بالرذاذ الكهربائي أو الحراري، في تيار من الرذاذ، والذي يتبخر بدوره إلى تيار أيوني. وقد حلّت تقنية ESI محلّ تقنية TSI في معظم الأغراض. [ 11 ] : القسم 3.3
في تقنية TSI، يدخل المحلول إلى أنبوب شعري ساخن، مما ينتج عنه رذاذ من القطرات. يتبخر المذيب، تاركًا المواد المراد تحليلها متأينة. يمكن أن يحدث التأين نتيجة لثلاث عمليات محتملة:
- المادة المراد تحليلها موجودة بالفعل في شكل أيوني في المحلول، ويتم امتصاصها عند تبخر المذيب.
- انتقال الحمض والقاعدة. إذا كان المذيب محلولًا منظمًا ، فيمكن للمادة المراد تحليلها أن تتأين عن طريق تبادل بروتون مع المحلول المنظم. يُعد هذا النوع من التأين مناسبًا تمامًا لتقنية كروماتوغرافيا السائل-مطياف الكتلة (LC-MS)، لأن السائل المستخدم في كروماتوغرافيا السائل هو في الأصل محلول منظم.
- التأين بالرش البلازمي أو التشغيل بالخيط. يتم تأيين المذيب الموجود في الرش بواسطة شعاع إلكتروني عالي الطاقة. ثم يقوم المذيب المتأين بتأيين المادة المراد تحليلها كيميائياً.
في تقنية التأين بالرذاذ الإلكتروني (ESI)، يدخل المحلول إلى أنبوب شعري مُعرَّض لجهد عالٍ (عادةً 2-5 كيلو فولت)، مُنتجًا رذاذًا إلكترونيًا في حجرة مُسخَّنة في مواجهة تيار معاكس من غاز مُجفِّف (عادةً النيتروجين). يؤدي هذا إلى تبخير جزيئات المذيب. تزداد كثافة الشحنة على القطرة أثناء تبخرها، حتى تتغلب الطاقة الكهروستاتيكية على طاقة التوتر السطحي، مما يؤدي إلى انفجار القطرة. تتكرر هذه العملية، لتنتهي بتيار أيوني خالٍ من المذيب. يمكن أن يحدث التأين عن طريق: [ 11 ] : القسم 3.3
- تركيز الشحنة في القطرات أثناء التبخر.
- العمليات الكهروكيميائية الناجمة عن الجهد الكهروستاتيكي للشعيرة الدموية.
على عكس تقنية التأين بالرش الحراري (TSI)، قد تحمل أيونات المادة المُحللة الناتجة عن تقنية التأين بالرش الإلكتروني (ESI) شحنة مختلفة عن تلك التي تحملها المادة نفسها في المحلول. بمعنى آخر، قد تتحول المادة المُحللة الموجودة طبيعيًا على شكل M + في المحلول إلى سلسلة من الأيونات تحتوي على خليط من M + وM2 + وM3 + ، إلخ. يمكن للجزيئات الكبيرة أن تحمل شحنة كبيرة. تستطيع البروتينات النموذجية حمل العديد من البروتونات نظرًا لوجود سلاسل جانبية من الأحماض الأمينية القاعدية، مما ينتج عنه قمم عند m/z = 600-2000 للبروتينات ذات الوزن الجزيئي الذي يبلغ حوالي 200,000 دالتون. وهذا أمر مفيد، لأنه يعني أن الأيون لن يتجاوز حدود m/z في أجهزة تحليل الكتلة النموذجية. [ 11 ] : القسم 3.3
التأين بالامتزاز
Desorption ionization (DI) is a family of ionization techniques. The main examples are secondary-ion mass spectrometry (SIMS), fast atom bombardment (FAB), and matrix-assisted laser desorption ionization (MALDI). In DI, the sample is dissolved or dispersed in a matrix, and bombarded by a high-energy (1-10 keV) beam of ions (SIMS), neutral atoms (FAB), or photons (MALDI). The beam ionizes and expels (desorbs) some sample molecules off the matrix. The ion is then accelerated electrostatically, as in EI.[11]:Sec. 3.3
The matrix should be nonvolatile and relatively inert, so that it would not react with the analyte. It should also be a good electrolyte to allow ion formation. Ionized fragments of the matrix itself forms usually have , so the spectrogram usually filters out that segment.[11]:Sec. 3.3

| Method | Beam | Common beam | Matrix | Typical ions | Analyte range |
|---|---|---|---|---|---|
| SIMS | ions | Ar+, Cs+ | nonvolatile electrolyte | (M + H)+, (M − H)−, (M + Na)+, (M + K)+ | <20 kDa |
| FAB | neutral atoms | Ar, Xe | nonvolatile electrolyte | (M + H)+, (M − H)−, (M + Na)+, (M + K)+ | <20 kDa |
| MALDI | photons | N2 laser 337 nm, infrared laser | UV-absorbing organic | M+ | <300 kDa |
SIMS and FAB are quite similar. SIMS uses an ion beam, usually Ar+ or Cs+. FAB uses a neutral atom beam, usually Ar or Xe. For SIMS and FAB, if the matrix compound is more acidic than the analyte, then predominantly (M + H)+ forms formed, and conversely (M − H)−. Also possibly forming (M + Na)+, (M + K)+, etc, if the matrix is contaminated incidentally (adventitiously) by sodium, potassium, etc. Typical matrix materials include glycerol, thioglycerol, 3-nitrobenzyl alcohol, diethanolamine, triethanolamine, and dithiothreitol-dithioerythritol mixture. They are usually used to analyze polypeptides and oligonucleotides up to 20 kDa.[11]:Sec. 3.3
MALDE uses a photon beam, usually the soft-UV 337 nm nitrogen laser. It can also use an infrared (IR) laser for direct analysis of samples contained in gels or thin-layer chromatography (TLC) plates. MALDE can analyze small polymers (~1 kDa), to oligosaccharides, oligonucleotides and polypeptides, antibodies, up to small proteins (~300 kDa). It is highly sensitive, requiring only femtomoles of sample.[11]:Sec. 3.3
Desorption/ionization on silicon (DIOS) is similar to MALDE, but without the matrix. The sample is deposited directly on a nanostructured (porous silicon) surface and the sample desorbed directly from the nanostructured surface through the adsorption of laser light energy. DIOS has been used to analyze organic molecules, metabolites, biomolecules and peptides, and, ultimately, to image tissues and cells.[15]
Inductively coupled plasma

Inductively coupled plasma (ICP) sources are used primarily for cation analysis of a wide array of sample types. In this source, a plasma that is electrically neutral overall, but that has had a substantial fraction of its atoms ionized by high temperature, is used to atomize introduced sample molecules and to further strip the outer electrons from those atoms. The plasma is usually generated from argon gas, since the first ionization energy of argon atoms is higher than the first of any other elements except He, F and Ne, but lower than the second ionization energy of all except the most electropositive metals. The heating is achieved by a radio-frequency current passed through a coil surrounding the plasma.
Photoionization mass spectrometry
Photoionization can be used in experiments which seek to use mass spectrometry as a means of resolving chemical kinetics mechanisms and isomeric product branching.[16] In such instances a high energy photon, either X-ray or uv, is used to dissociate stable gaseous molecules in a carrier gas of He or Ar. In instances where a synchrotron light source is utilized, a tuneable photon energy can be utilized to acquire a photoionization efficiency curve which can be used in conjunction with the charge ratio m/z to fingerprint molecular and ionic species. More recently atmospheric pressure photoionization (APPI) has been developed to ionize molecules mostly as effluents of LC-MS systems.
Ambient ionization
تشمل بعض تطبيقات التأين المحيطي تطبيقات بيئية وسريرية. في هذه التقنيات، تتشكل الأيونات في مصدر أيوني خارج مطياف الكتلة. يصبح أخذ العينات سهلاً لأنها لا تحتاج إلى فصل أو تحضير مسبق. من أمثلة تقنيات التأين المحيطي: التحليل المباشر في الوقت الحقيقي (DART)، وDESI ، وSESI ، وLAESI ، والتأين الكيميائي بالضغط الجوي (APCI)، والتأين الكيميائي بالضغط الجوي بالامتزاز (DAPCI)، والتأين اللين بالتفاعل الكيميائي أثناء النقل (SICRT)، والتأين الضوئي بالضغط الجوي بالامتزاز (DAPPI)، وغيرها.
تقنيات تأيين أخرى
وتشمل الأنواع الأخرى التفريغ المتوهج ، والامتزاز الميداني (FD)، والتأين الشراري ، والتأين الحراري (TIMS). [ 17 ]
محلل الكتلة
تقوم أجهزة تحليل الكتلة بفصل الأيونات وفقًا لنسبة كتلتها إلى شحنتها .
توجد أنواع عديدة من أجهزة تحليل الكتلة، تستخدم إما مجالات ثابتة أو ديناميكية، مغناطيسية أو كهربائية. ولكل نوع منها مزايا وعيوب. تستخدم العديد من مطيافات الكتلة جهازي تحليل كتلة أو أكثر في مطيافية الكتلة الترادفية (MS/MS) . إضافةً إلى أجهزة تحليل الكتلة الأكثر شيوعًا المذكورة أدناه، توجد أجهزة أخرى مصممة لحالات خاصة.
نظرية
يحكم القانونان التاليان ديناميكيات الجسيمات المشحونة في المجالات الكهربائية والمغناطيسية في الفراغ:
- ( قانون قوة لورنتز )؛

- ( قانون نيوتن الثاني للحركة في الحالة غير النسبية، أي أنه صالح فقط عند سرعة الأيونات الأقل بكثير من سرعة الضوء).

هنا، F هي القوة المؤثرة على الأيون، وm هي كتلة الأيون، وa هي التسارع، وQ هي شحنة الأيون، وE هو المجال الكهربائي، و v × B هو حاصل الضرب الاتجاهي لسرعة الأيون والمجال المغناطيسي
بمساواة التعبيرات أعلاه للقوة المطبقة على الأيون، نحصل على:

This differential equation is the classic equation of motion for charged particles. Together with the particle's initial conditions, it completely determines the particle's motion in space and time in terms of m/Q. Thus mass spectrometers could be thought of as "mass-to-charge spectrometers". When presenting data, it is common to use the (officially) dimensionlessm/z, where z is the number of elementary charges (e) on the ion (z=Q/e). This quantity, although it is informally called the mass-to-charge ratio, more accurately speaking represents the ratio of the mass number and the charge number, z.
Analyzer characteristics
There are several important analyzer characteristics.
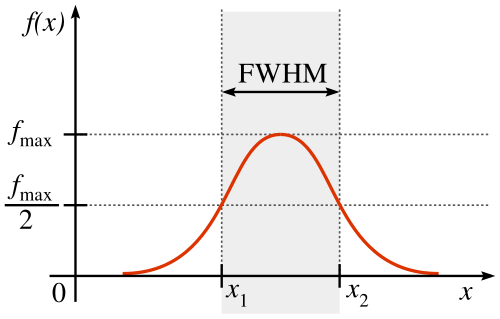
The mass resolving power is the just detectable difference in m/z, at that particular m/z, usually measured measured in milli mass units (mDa). In particular, the resolution may be different at different m/z. It is usually operationalized as the full width at half maximum a peak at that given m/z.

The resolution is the ratio . It is unitless. A "high-resolution" mass analyzer typically has resolution >1 million. Concretely, that means it can resolve two peaks at ~1 kDa, differing by just ~1 mDa.

The absolute accuracy is the ratio of the m/z measurement error to the true m/z. It is defined as . The relative accuracy is . It is unitless.


The mass range is the range of m/z that a given analyzer can analyze.
The speed is the number of spectra lines per unit time that can be generated. Typically, higher resolution requires lower speed, and vice versa. Some mass spectrometers, such as the Fourier transform spectrometers, allow a continuous tradeoff between speed and resolution.
Sector
A sector-type mass analyzer uses a static electric and/or magnetic field to control the path of the ion beam. The most common type uses a magnetic field.
In a simplified case, the field is a constant field , and we have an ion of mass and charge that enters the field perpendicularly at velocity . Then, in the field, the ion undergoes circular motion of radius . If the ionizer has accelerated the ion under a known voltage , then the kinetic energy of the ion is , giving[11]:Sec. 3.4Thus, the single input ion beam is analyzed into a fan of ion beams, the higher m/z ions turning at a larger radius. One can then select for one m/z by using a moving narrow slit. One can also use a fixed narrow slit, but vary or .


If there is just a single detector, then the analyzer can sweep across the mass spectrum one slit at a time. With multiple detectors, the speed of analysis increases.[18]
A pure magnetic sector analyzer can achieve resolution ~10,000. With an added electrostatic focusing field before or after the magnetic sector, the analyzer can achieve resolution ~100,000.[11]:Sec. 3.4
Particularly unstable ions may disintegrate while passing through the analyzer. If it undergoes the reaction Mz+ → M'z+ + (other parts) when entering the analyzer, it would undergo a circular motion of radius . This would then show up in the resulting spectrogram as a peak that is apparently made by an ion with . Since there is no actual ion with mass , this is called an abnormal peak, or a metastable ion peak. In general, a meta stable ion peak is a broad peak centered at a highly non-integer value of . The existence of a metastable ion peak at is strong evidence that two ions of masses are in fact related by the reaction Mz+ → M'z+ + (other parts).[11]:Sec. 3.5


Time-of-flight
The time-of-flight (TOF) analyzer takes as input a short pulse of ions, and lets it fly through a long vacuum tube. Ions with different m/z would arrive at the end of the tube at different times, thus analyzing them. The ions must enter the tube as pulses, because otherwise the TOF cannot be measured. If the ionizer outputs a continuous stream of ions, then it must be cut up into ion pulses, by methods such as a fast mechanical shutter, an oscillating electric field plus a narrow slit, etc. The MALDI ionizer is particularly well-suited for TOF analyzer, since the laser used in MALDI is usually a high-intensity pulse laser. MALDI-TOF has allowed measurement of mass spetrograms using only a few attomoles of material.[11]:Sec. 3.4
Concretely, let the length of the analyzer be , then the time taken for an ion of velocity to pass through the analyzer is . Since , we have[11]:Sec. 3.4Often, the input ions are already concentrated in their m/z. That is, each ion in the input satisfies , where is a constant, and في هذه الحالة، لديناهذا يعني أنه يمكن قياس الإشارة بواسطة راسم الإشارة في وضع التشغيل. في الواقع، أُجري أول تحليل كروماتوغرافي غازي-مطياف كتلة (GC-MS) عام 1950 باستخدام راسم الإشارة. التقط الباحثون صورًا سريعة لشاشة راسم الإشارة لكل مكون يخرج من جهاز كروماتوغرافيا الغاز. [ 19 ]


يؤدي هذا التوزيع في السرعات إلى توسيع القمم الظاهرة في مخطط عدد الأيونات مقابل نسبة الكتلة إلى الشحنة ( m/z) ، ولكنه لا يُغير عادةً الموقع المركزي لهذه القمم، لأن السرعة الابتدائية للأيونات تكون عادةً عند الصفر. ولحل هذه المشكلة، تم دمج تقنية التركيز المتأخر/الاستخلاص المؤجل مع مطياف الكتلة ذي زمن الطيران (TOF-MS). [ 20 ] إذا لم تبدأ الأيونات بطاقات حركية متطابقة، فقد تتأخر بعض الأيونات عن الأيونات ذات الطاقة الحركية الأعلى، مما يُقلل من الدقة. وتُستخدم هندسة العاكس بشكل شائع لتصحيح هذه المشكلة. [ 21 ]
تؤدي الأنابيب الأطول إلى دقة أعلى. ويضاعف العاكس طول الأنبوب الفعال. ويمكن لجهاز مطياف الكتلة ذي زمن الطيران العاكس أن يصل إلى دقة تصل إلى عدة آلاف. وعلى الرغم من دقتها المنخفضة، تعوض مطيافات الكتلة ذات زمن الطيران ذلك بالسرعة. وهي مفيدة بشكل خاص في دراسات الحركية الكيميائية ، حيث يمكنها دراسة التفاعلات السريعة مثل الاحتراق والانفجارات. [ 11 ] : القسم 3.4
مرشح الكتلة الرباعي
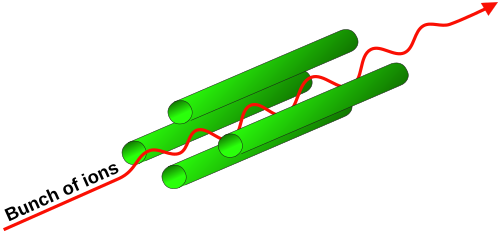
يستخدم محلل الكتلة رباعي الأقطاب أربعة قضبان معدنية متوازية لإنشاء مجال كهربائي رباعي الأقطاب يتذبذب بترددات الراديو (RF)، وذلك لتحقيق استقرار أو عدم استقرار مسارات الأيونات التي تمر عبره بشكل انتقائي.
مع كل نمط تذبذب، تخضع الأيونات المارة لحركة حلزونية. إذا كان للأيون نسبة كتلة إلى شحنة (m/z) ضمن نطاق معين، تكون الحركة الحلزونية مستقرة. وإلا، فإن سعة الحركة الحلزونية ستزداد حتى يصطدم الأيون بالقضبان. هذا يعني أن الأيونات ذات نسبة m/z ضمن نطاق ضيق فقط هي التي يمكنها المرور. يمكن مسح الطيف الكامل بتغيير الجهد الكهربائي على القضبان، بشكل مستمر أو على شكل قفزات منفصلة متتالية.
تتميز هذه الأجهزة عادةً بدقة منخفضة تبلغ حوالي 1000، لكنها رخيصة وصغيرة الحجم، لذا فهي مناسبة لأجهزة قياس الطيف الكتلي المكتبية. [ 11 ] : القسم 3.4
يُعدّ مرشح الكتلة رباعي الأقطاب وثيق الصلة بمصيدة الأيونات رباعية الأقطاب ، ولا سيما مصيدة الأيونات رباعية الأقطاب الخطية، إلا أنه مصمم لتمرير الأيونات غير المحصورة بدلاً من تجميع الأيونات المحصورة، ولذلك يُشار إليه باسم مرشح النقل رباعي الأقطاب. ويمكن استخدام مصيدة الأيونات رباعية الأقطاب نفسها كمحلل، كما هو الحال في محللات مصائد الأيونات .
A common variation of the transmission quadrupole is the triple quadrupole mass spectrometer. The "triple quad" has three consecutive quadrupole stages, the first acting as a mass filter to transmit a particular incoming ion to the second quadrupole, a collision chamber, wherein that ion can be broken into fragments. The third quadrupole also acts as a mass filter, to transmit a particular fragment ion to the detector. It is a kind of MS/MS, and so it can perform various scan types characteristic of MS/MS.
A magnetically enhanced quadrupole mass analyzer has an additional magnetic field, axial or transverse.[22][23]
Ion traps
Three-dimensional quadrupole ion trap
The quadrupole ion trap works on the same physical principles as the quadrupole mass analyzer, but the ions are trapped and sequentially ejected. Ions are trapped in a mainly quadrupole RF field, in a space defined by a ring electrode (usually connected to the main RF potential) between two endcap electrodes (typically connected to DC or auxiliary AC potentials). The sample is ionized either internally (e.g. with an electron or laser beam), or externally, in which case the ions are often introduced through an aperture in an endcap electrode.
There are many mass/charge separation and isolation methods but the most commonly used is the mass instability mode in which the RF potential is ramped so that the orbit of ions with a mass a>b are stable while ions with mass b become unstable and are ejected on the z-axis onto a detector. There are also non-destructive analysis methods.
Ions may also be ejected by the resonance excitation method, whereby a supplemental oscillatory excitation voltage is applied to the endcap electrodes, and the trapping voltage amplitude and/or excitation voltage frequency is varied to bring ions into a resonance condition in order of their mass/charge ratio.[24][25]
Cylindrical ion trap
The cylindrical ion trap mass spectrometer (CIT) is a derivative of the quadrupole ion trap where the electrodes are formed from flat rings rather than hyperbolic shaped electrodes. The architecture lends itself well to miniaturization because as the size of a trap is reduced, the shape of the electric field near the center of the trap, the region where the ions are trapped, forms a shape similar to that of a hyperbolic trap.
Linear quadrupole ion trap
A linear quadrupole ion trap is similar to a quadrupole ion trap, but it traps ions in a two dimensional quadrupole field, instead of a three-dimensional quadrupole field as in a 3D quadrupole ion trap. Thermo Fisher's LTQ ("linear trap quadrupole") is an example of the linear ion trap.[26]
A toroidal ion trap can be visualized as a linear quadrupole curved around and connected at the ends or as a cross-section of a 3D ion trap rotated on edge to form the toroid, donut-shaped trap. The trap can store large volumes of ions by distributing them throughout the ring-like trap structure. This toroidal shaped trap is a configuration that allows the increased miniaturization of an ion trap mass analyzer. Additionally, all ions are stored in the same trapping field and ejected together simplifying detection that can be complicated with array configurations due to variations in detector alignment and machining of the arrays.[27]
As with the toroidal trap, linear traps and 3D quadrupole ion traps are the most commonly miniaturized mass analyzers due to their high sensitivity, tolerance for mTorr pressure, and capabilities for single analyzer tandem mass spectrometry (e.g. product ion scans).[28]
Fourier-transform ion cyclotron resonance

Fourier-transform mass spectrometry (FTMS), or more precisely Fourier-transform ion cyclotron resonance mass spectrometry (FT-ICR MS), measures mass by detecting the image current produced by ions spiralling in the presence of a magnetic field. Instead of measuring the deflection of ions with a detector such as an electron multiplier, the ions are injected into a Penning trap (a static electric/magnetic ion trap) where they effectively form part of a circuit. Detectors at fixed positions in space measure the electrical signal of ions which pass near them over time, producing a periodic signal. Since the frequency of an ion's cycling is determined by its m/z ratio, this can be deconvoluted by Fourier transform on the signal.[29][30]
Ion cyclotron resonance (ICR) is an older mass analysis technique. It is similar to FTMS, in that the ions undergo cyclotron resonane. However, the ions are detected with a traditional detector. Ions trapped in a Penning trap are excited by an RF electric field until they impact the wall of the trap, where the detector is located. Ions of different mass are resolved according to impact time.
يُعدّ مطياف الكتلة بتحويل فورييه (FTMS) عمومًا أكثر أجهزة التحليل حساسيةً في السوق، إذ تصل دقته إلى حوالي مليون. ويعود هذا إلى أن كل أيون يُقاس عدة مرات بواسطة المطياف. ومن منظور مبدأ عدم اليقين في معالجة الإشارات ، فإن الإشارة المتذبذبة غير الموضعية زمنيًا تكون أيضًا موضعية تردديًا.
أوربيتراب
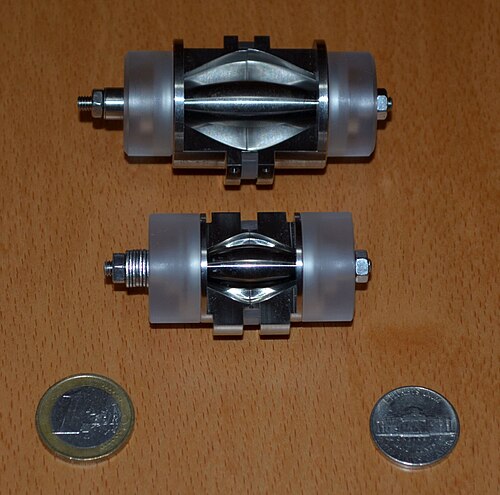
تُشبه أجهزة تحليل أوربيتراب أجهزة تحليل FTMS. تُحصر الأيونات كهربائيًا في مدار حول قطب كهربائي مركزي مغزلي الشكل. يحصر القطب الأيونات بحيث تدور حوله وتتذبذب ذهابًا وإيابًا على طول محوره الطولي. يُولّد هذا التذبذب تيارًا وهميًا في ألواح الكاشف، يُسجّله الجهاز. تعتمد ترددات هذه التيارات الوهمية على نسب الكتلة إلى الشحنة للأيونات. تُستخلص أطياف الكتلة بتحويل فورييه للتيارات الوهمية المسجلة.
تتميز أجهزة أوربيتراب بدقة عالية في قياس الكتلة، وحساسية عالية، ونطاق ديناميكي جيد. كما أنها صغيرة الحجم نسبياً. [ 31 ]
دقة عالية
تتشابه بعض المركبات الكيميائية في تركيبها الكيميائي، لكنها تختلف في نظائرها ( النظائر المتناظرة ). ويمكن التمييز بينها باستخدام جهاز تحليل بسيط للغاية. في الواقع، اكتُشفت النظائر عام 1922، في بدايات علم قياس الطيف الكتلي.
مع ذلك، قد يمتلك نوعان كيميائيان نفس عدد النيوكليونات (النيوترونات والبروتونات). على سبيل المثال، يحتوي كل من C3 و SH4 على 36 نيوكليونًا. ومع ذلك، يمكن التمييز بينهما، نظرًا لاختلاف كتلة البروتون والنيوترون بمقدار 1.4 ملي دالتون، ولأن النوى المختلفة لها طاقة ربط مختلفة ، والتي ...ينتج عن ذلك اختلاف في الكتلة. والنتيجة النهائية هي أن C₃ و S₁H₄ يختلفان بمقدار 3.4 ملي دالتون . ويمكن تحقيق اختلافات أصغر من خلال مطابقة النظائر بدقة. على سبيل المثال، يختلف C₄ و S₁H₃¹³C₁ بمقدار 1.1 ملي دالتون . ويمكن فصل هذه الاختلافات باستخدام مطياف الكتلة عالي الدقة، الذي تصل دقته إلى أكثر من مليون، وهو ما يكفي لفصل فرق مقداره 1 ملي دالتون تقريبًا عند m / z ≈ 1000. تجدر الإشارة إلى أن كتلة الإلكترون هي 0.5 ملي دالتون. [ 32 ]

There are many techniques for high resolution MS,[33] but the highest resolution is achieved by FTMS with high magnetic field. With increasing magnetic field strength, the resolution and spectral acquisition speed increases linearly, while mass accuracy and dynamic range increases quadratically.[34] Consequently, the highest resolution is achieved by high field FTMS, up to 21 Tesla. It reaches resolution >2.7 million at m/z ~ 400, and mass measurement accuracy < 80 ppb.[35][32]
They are often employed in geochemical and petrochemical studies, since there is a lot of money in petroleum industry, and petroleum composition is highly complex.[32] Another application is in isotopic analysis of large proteins. Two proteins differing by a single isotopic atom are separated by , requiring a resolution of to resolve. For large proteins with m > 100 kDa and z ~ 50, such as monoclonal antibodies, this requires an analyzer that achieves resolving power > 100,000 at m/z ~ 2000.[35]


High resolution FTMS is also very sensitive as a detector. It has allowed detecting proteins in the 8–20 kDa range at a sample concentration of ~30 zeptomole (i.e. about 20,000 individual molecules).[36]
When the mass of a single ion species is to be measured, the highest precision achievable is via Penning-type traps. The PENTATRAP for example measures the mass of long-lived, highly charged, heavy ions, to a precision of .[37] This is sufficiently sensitive to directly measure the energy of metastable electronic states to an accuracy of ~1 eV via the mass-energy equation.[38]

Detectors
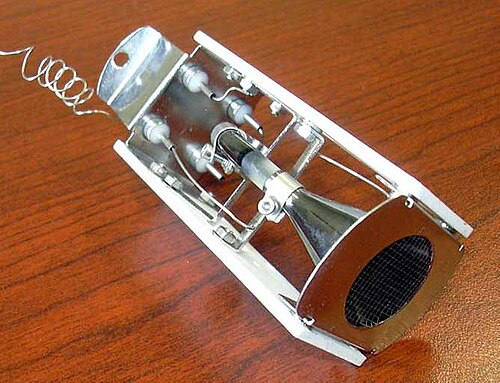
The final element of the mass spectrometer is the detector. The detector records either the charge induced or the current produced when an ion passes by or hits a surface. In a scanning instrument, the signal produced in the detector during the course of the scan versus where the instrument is in the scan (at what m/Q) will produce a mass spectrum, a record of ions as a function of m/Q.
The linear dynamic range is the range over which the detector signal is linear with analyte concentration.
يُستخدم عادةً نوعٌ من مُضاعِفات الإلكترونات ، مع استخدام كواشف أخرى، منها أكواب فاراداي وكواشف تحويل الأيونات إلى فوتونات . ولأن عدد الأيونات الخارجة من محلل الكتلة في لحظة معينة يكون عادةً ضئيلاً، فغالباً ما يكون التضخيم الكبير ضرورياً للحصول على إشارة. تُستخدم كواشف الألواح ذات القنوات الدقيقة بشكل شائع في الأجهزة التجارية الحديثة. [ 39 ] في مطيافية الكتلة بتحويل فورييه (FTMS) ومصائد الأيونات المدارية (Orbitraps) ، يتكون الكاشف من سطحين معدنيين داخل منطقة محلل الكتلة/مصيدة الأيونات، حيث تمر الأيونات بالقرب منهما فقط أثناء تذبذبها. لا يُنتج تيار مباشر، بل يُنتج فقط تيار صورة متناوب ضعيف في دائرة بين الأقطاب الكهربائية. كما استُخدمت كواشف حثية أخرى. [ 40 ]
مطياف الكتلة الترادفي
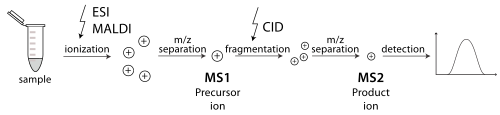
مطياف الكتلة الترادفي هو جهاز قادر على إجراء عدة دورات من قياس الطيف الكتلي، يفصل بينها عادةً نوع من أنواع تجزئة الجزيئات . على سبيل المثال، يمكن لمحلل كتلة واحد عزل ببتيد واحد من بين العديد من الببتيدات الداخلة إلى مطياف الكتلة. ثم تعمل خلية التصادم على تثبيت أيونات الببتيد أثناء تصادمها مع الغاز، مما يؤدي إلى تجزئتها عن طريق التفكك الناتج عن التصادم (CID). بعد ذلك، يقوم محلل كتلة آخر بفرز الشظايا الناتجة عن الببتيدات. يمكن أيضًا إجراء قياس الطيف الكتلي الترادفي في محلل كتلة واحد على مدى فترة زمنية، كما هو الحال في مصيدة الأيونات رباعية الأقطاب . هناك طرق متنوعة لتجزئة الجزيئات في قياس الطيف الكتلي الترادفي، بما في ذلك التفكك الناتج عن التصادم (CID)، والتفكك بالتقاط الإلكترون (ECD)، والتفكك بنقل الإلكترون (ETD)، والتفكك متعدد الفوتونات بالأشعة تحت الحمراء (IRMPD)، والتفكك الإشعاعي بالأشعة تحت الحمراء للجسم الأسود (BIRD)، والتفكك بفصل الإلكترون (EDD)، والتفكك الناتج عن السطح (SID). يُعد تحديد البروتينات أحد التطبيقات المهمة التي تستخدم مطياف الكتلة الترادفي. [ 41 ]
يُمكّن مطياف الكتلة الترادفي من إجراء مجموعة متنوعة من التسلسلات التجريبية. وقد صُممت العديد من أجهزة مطياف الكتلة التجارية لتسريع تنفيذ التسلسلات الروتينية مثل مراقبة التفاعل الانتقائي ، ومسح أيونات السلائف، ومسح أيونات الناتج، ومسح فقدان الجزيئات المتعادلة. [ 42 ]
- In selected reaction monitoring, the first analyzer allows only a single mass through and the second analyzer monitors for multiple user-defined fragment ions over longer dwell-times than could be achieved in a full scan. This increases sensitivity.
- In product ion scans, the first mass analyzer is fixed to select a particular precursor ion ("parent"), while the second is scanned to find all the fragments ("products", or "daughter ions") to which it can be fragmented in the collision cell.
- In precursor ion scans, the second mass analyzer is fixed to select a particular fragment ion ("daughter"), while the first is scanned to find all possible precursor ions that could give rise to this fragment.
- In neutral loss scans, the two mass analyzers are scanned in parallel, but separated by the mass of a molecular subunit of interest to the analyst. Ions are detected if they lose that fixed mass during fragmentation. This can be used to look for any chemical that is capable of losing a particular neutral group, for example a sugar residue. Together, neutral loss and precursor ion scans can be used to hunt for chemicals with particular motifs.
Another type of tandem mass spectrometry used for radiocarbon dating is accelerator mass spectrometry, which uses very high voltages, usually in the mega-volt range, to accelerate negative ions into a type of tandem mass spectrometer.
The METLIN Metabolite and Chemical Entity Database[43][44][45][46][47] is the largest repository of experimental tandem mass spectrometry data acquired from standards. The tandem mass spectrometry data on over 960,000 molecular standards (as of October 2025)[43][46] is provided to facilitate the identification of chemical entities from tandem mass spectrometry experiments.[48] In addition to the identification of known molecules it is also useful for identifying unknowns using its similarity searching/analysis.[49] All tandem mass spectrometry data comes from the experimental analysis of standards at multiple collision energies and in both positive and negative ionization modes.[43]
Common mass spectrometer configurations and techniques
When a specific combination of source, analyzer, and detector becomes conventional in practice, a compound acronym may arise to designate it succinctly. One example is MALDI-TOF, which refers to a combination of a matrix-assisted laser desorption/ionization source with a time-of-flight mass analyzer. Other examples include inductively coupled plasma-mass spectrometry (ICP-MS), accelerator mass spectrometry, thermal ionization-mass spectrometry (TIMS) and spark source mass spectrometry.
Certain applications of mass spectrometry have developed monikers that although strictly speaking would seem to refer to a broad application, in practice have come instead to connote a specific or a limited number of instrument configurations. An example of this is isotope-ratio mass spectrometry, which refers in practice to the use of a limited number of sector based mass analyzers; this name is used to refer to both the application and the instrument used for the application.
Separation techniques combined with mass spectrometry
An important enhancement to the mass resolving and mass determining capabilities of mass spectrometry is using it in tandem with chromatographic and other separation techniques.
Gas chromatography
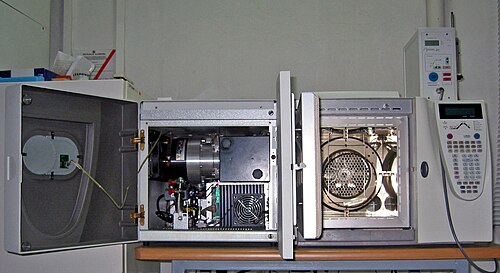
A common combination is gas chromatography-mass spectrometry (GC/MS or GC-MS). In this technique, a gas chromatograph is used to separate different compounds. This stream of separated compounds is fed online into the ion source, a metallicfilament to which voltage is applied. This filament emits electrons which ionize the compounds. The ions can then further fragment, yielding predictable patterns. Intact ions and fragments pass into the mass spectrometer's analyzer and are eventually detected.[50] However, the high temperatures (300 °C) used in the GC-MS injection port (and oven) can result in thermal degradation of injected molecules, thus resulting in the measurement of degradation products instead of the actual molecule(s) of interest.[51]
Liquid chromatography
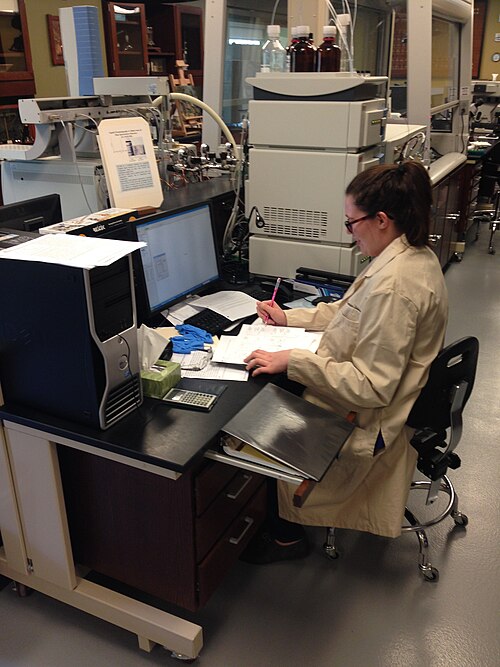
Similarly to gas chromatography MS (GC-MS), liquid chromatography-mass spectrometry (LC/MS or LC-MS) separates compounds chromatographically before they are introduced to the ion source and mass spectrometer. It differs from GC-MS in that the mobile phase is liquid, usually a mixture of water and organic solvents, instead of gas. Most commonly, an electrospray ionization source is used in LC-MS. Other popular and commercially available LC-MS ion sources are atmospheric pressure chemical ionization and atmospheric pressure photoionization. There are also some newly developed ionization techniques like laser spray.
Capillary electrophoresis–mass spectrometry
Capillary electrophoresis–mass spectrometry (CE-MS) is a technique that combines the liquid separation process of capillary electrophoresis with mass spectrometry.[52] CE-MS is typically coupled to electrospray ionization.[53]
Ion mobility
Ion mobility spectrometry-mass spectrometry (IMS/MS or IMMS) is a technique where ions are first separated by drift time through some neutral gas under an applied electrical potential gradient before being introduced into a mass spectrometer.[54] Drift time is a measure of the collisional cross section relative to the charge of the ion. The duty cycle of IMS (the time over which the experiment takes place) is longer than most mass spectrometric techniques, such that the mass spectrometer can sample along the course of the IMS separation. This produces data about the IMS separation and the mass-to-charge ratio of the ions in a manner similar to LC-MS.[55]
The duty cycle of IMS is short relative to liquid chromatography or gas chromatography separations and can thus be coupled to such techniques, producing triple modalities such as LC/IMS/MS.[56]
Data and analysis

Data representations
Mass spectrometry produces various types of data. The most common data representation is the mass spectrum.
Certain types of mass spectrometry data are best represented as a mass chromatogram. Types of chromatograms include selected ion monitoring (SIM), total ion current (TIC), and selected reaction monitoring, among many others.
Other types of mass spectrometry data are well represented as a three-dimensional contour map. In this form, the mass-to-charge, m/z is on the x-axis, intensity the y-axis, and an additional experimental parameter, such as time, is recorded on the z-axis.
Data analysis
Mass spectrometry data analysis is specific to the type of experiment producing the data. General subdivisions of data are fundamental to understanding any data.
Many mass spectrometers work in either negative ion mode or positive ion mode. It is very important to know whether the observed ions are negatively or positively charged. This is often important in determining the neutral mass but it also indicates something about the nature of the molecules.
Different types of ion source result in different arrays of fragments produced from the original molecules. An electron ionization source produces many fragments and mostly single-charged (1-) radicals (odd number of electrons), whereas an electrospray source usually produces non-radical quasimolecular ions that are frequently multiply charged. Tandem mass spectrometry purposely produces fragment ions post-source and can drastically change the sort of data achieved by an experiment.
Knowledge of the origin of a sample can provide insight into the component molecules of the sample and their fragmentations. A sample from a synthesis/manufacturing process will probably contain impurities chemically related to the target component. A crudely prepared biological sample will probably contain a certain amount of salt, which may form adducts with the analyte molecules in certain analyses.
Results can also depend heavily on sample preparation and how it was run/introduced. An important example is the issue of which matrix is used for MALDI spotting, since much of the energetics of the desorption/ionization event is controlled by the matrix rather than the laser power. Sometimes samples are spiked with sodium or another ion-carrying species to produce adducts rather than a protonated species.
Mass spectrometry can measure molar mass, molecular structure, and sample purity. Each of these questions requires a different experimental procedure; therefore, adequate definition of the experimental goal is a prerequisite for collecting the proper data and successfully interpreting it.
Interpretation of mass spectra
Since the precise structure or peptide sequence of a molecule is deciphered through the set of fragment masses, the interpretation of mass spectra requires combined use of various techniques. Usually the first strategy for identifying an unknown compound is to compare its experimental mass spectrum against a library of mass spectra. If no matches result from the search, then manual interpretation[57] or software assisted interpretation of mass spectra must be performed. Computer simulation of ionization and fragmentation processes occurring in mass spectrometer is the primary tool for assigning structure or peptide sequence to a molecule. An a priori structural information is fragmented in silico and the resulting pattern is compared with observed spectrum. Such simulation is often supported by a fragmentation library[58] that contains published patterns of known decomposition reactions. Software taking advantage of this idea has been developed for both small molecules and proteins.
Analysis of mass spectra can also be spectra with accurate mass. A mass-to-charge ratio value (m/z) with only integer precision can represent an immense number of theoretically possible ion structures; however, more precise mass figures significantly reduce the number of candidate molecular formulas. A computer algorithm called formula generator calculates all molecular formulas that theoretically fit a given mass with specified tolerance.
A recent technique for structure elucidation in mass spectrometry, called precursor ion fingerprinting, identifies individual pieces of structural information by conducting a search of the tandem spectra of the molecule under investigation against a library of the product-ion spectra of structurally characterized precursor ions.[59]
Particularly unstable ions may disintegrate while passing through the analyzer. If it undergoes the reaction Mz+ → M'z+ + (other parts) when entering the analyzer, it would undergo a circular motion of radius . This would then show up in the resulting spectrogram as a peak that is apparently made by an ion with . Since there is no actual ion with mass , this is called an abnormal peak, or a metastable ion peak. In general, a meta stable ion peak is a broad peak centered at a highly non-integer value of . The existence of a metastable ion peak at is strong evidence that two ions of masses are in fact related by the reaction Mz+ → M'z+ + (other parts).[11]:Sec. 3.5
Applications
Mass spectrometry has both qualitative and quantitative uses. These include identifying unknown compounds, determining the isotopic composition of elements in a molecule, and determining the structure of a compound by observing its fragmentation. Other uses include quantifying the amount of a compound in a sample or studying the fundamentals of gas phase ion chemistry (the chemistry of ions and neutrals in a vacuum). MS is now commonly used in analytical laboratories that study physical, chemical, or biological properties of a great variety of compounds. Quantification can be relative (analyzed relative to a reference sample) or absolute (analyzed using a standard curve method).[60]
As an analytical technique it possesses distinct advantages such as: Increased sensitivity over most other analytical techniques because the analyzer, as a mass-charge filter, reduces background interference, Excellent specificity from characteristic fragmentation patterns to identify unknowns or confirm the presence of suspected compounds, Information about molecular weight, Information about the isotopic abundance of elements, Temporally resolved chemical data.
A few of the disadvantages of the method is that it often fails to distinguish between optical and geometrical isomers and the positions of substituent in o-, m- and p- positions in an aromatic ring. Also, its scope is limited in identifying hydrocarbons that produce similar fragmented ions.
Isotope ratio mass spectrometry

تُستخدم مطيافية الكتلة أيضًا لتحديد التركيب النظائري للعناصر داخل العينة. تكون الفروق في الكتلة بين نظائر العنصر الواحد ضئيلة للغاية، وعادةً ما تكون النظائر الأقل وفرة نادرة جدًا، لذا يلزم جهاز بالغ الحساسية. لقياس العناصر الخفيفة (مثل الهيدروجين والكربون والنيتروجين والأكسجين والكبريت)، تستخدم مطيافات الكتلة لنسب النظائر عادةً مغناطيسًا واحدًا لتوجيه حزمة من الجسيمات المتأينة نحو سلسلة من أكواب فاراداي التي تحول اصطدامات الجسيمات إلى تيار كهربائي . يمكن إجراء تحليل سريع ومباشر لمحتوى الديوتيريوم في الماء باستخدام مطيافية الكتلة بالتوهج اللاحق المتدفق (FA-MS). ولعل مطيافية الكتلة المُسرّعة هي الأكثر حساسية ودقة لهذا الغرض ، نظرًا لحساسيتها الفائقة وقدرتها على قياس الذرات الفردية والنويدات بنطاق ديناميكي يصل إلى 10^ 15 تقريبًا بالنسبة للنظير المستقر الرئيسي. [ 61 ] يمكن أن تكون البصمات النظائرية مؤشرات على مجموعة متنوعة من العمليات. تُستخدم بعض نسب النظائر لتحديد عمر المواد، على سبيل المثال كما هو الحال في التأريخ بالكربون المشع . كما يُستخدم الوسم بالنظائر المستقرة لتحديد كمية البروتين (انظر توصيف البروتين أدناه).
مطيافية الكتلة عبر الغشاء: قياس الغازات في المحلول
تجمع تقنية مطيافية الكتلة عبر الغشاء بين مطيافية الكتلة لنسب النظائر وحجرة/خلية تفاعل مفصولة بغشاء نفاذ للغازات. تتيح هذه الطريقة دراسة الغازات أثناء تطورها في المحلول. وقد استُخدمت هذه الطريقة على نطاق واسع لدراسة إنتاج الأكسجين بواسطة النظام الضوئي الثاني . [ 62 ]
تحليل الغازات النزرة
تستخدم العديد من التقنيات الأيونات التي يتم إنشاؤها في مصدر أيوني مخصص يتم حقنه في أنبوب تدفق أو أنبوب انجراف: أنبوب تدفق الأيونات المحدد (SIFT-MS) وتفاعل نقل البروتون (PTR-MS) هي متغيرات من التأين الكيميائي مخصصة لتحليل الغازات النزرة في الهواء أو الزفير أو الفراغ العلوي السائل باستخدام وقت تفاعل محدد جيدًا يسمح بحساب تركيزات التحليل من حركية التفاعل المعروفة دون الحاجة إلى معيار داخلي أو معايرة.
تُعدّ تقنية التأين بالرذاذ الكهربائي الثانوي (SESI-MS) تقنية أخرى تُستخدم في مجال تحليل الغازات النزرة ، وهي نوعٌ مُعدّل من تقنية التأين بالرذاذ الكهربائي . تتكون تقنية SESI من رذاذ كهربائي من مذيب حمضي نقي يتفاعل مع الأبخرة المتعادلة. تتأين جزيئات البخار عند الضغط الجوي عندما تنتقل الشحنة من الأيونات المتكونة في الرذاذ الكهربائي إلى الجزيئات. من مزايا هذه التقنية أنها متوافقة مع معظم أنظمة ESI-MS. [ 63 ] [ 64 ]
تحليل الغاز المتبقي
محلل الغازات المتبقية (RGA) هو مطياف كتلة صغير الحجم ومتين عادةً ، مصمم خصيصًا للتحكم في العمليات ومراقبة التلوث في أنظمة التفريغ . عند تصميمه كمحلل كتلة رباعي الأقطاب ، يتوفر بنوعين: أحدهما يستخدم مصدر أيونات مفتوح (OIS) والآخر يستخدم مصدر أيونات مغلق (CIS). تُستخدم أجهزة تحليل الغازات المتبقية في تطبيقات التفريغ العالي ، مثل غرف الأبحاث، وأجهزة علوم الأسطح ، والمسرعات ، والمجاهر الماسحة ، وغيرها. في معظم الحالات، تُستخدم هذه الأجهزة لمراقبة جودة التفريغ والكشف بسهولة عن آثار ضئيلة من الشوائب في بيئة الغاز منخفضة الضغط. يمكن قياس هذه الشوائب بدقة تصل إلىمستويات تور ، التي تتمتع بإمكانية الكشف عنها بأجزاء في المليون في غياب التداخلات الخلفية.

تُستخدم أجهزة تحليل الغازات المتبقية (RGAs) أيضًا كأجهزة كشف تسرب حساسة في الموقع، وتستخدم عادةً الهيليوم أو كحول الأيزوبروبيل أو جزيئات تتبع أخرى. مع أنظمة التفريغ التي يتم تفريغها إلى أقل منتور - فحص سلامة موانع التسرب الفراغية وجودة الفراغ - يمكن اكتشاف تسربات الهواء، والتسريبات الافتراضية، والملوثات الأخرى بمستويات منخفضة قبل بدء العملية.

مسبار ذري
مسبار الذرات هو أداة تجمع بين قياس الطيف الكتلي بزمن الطيران ومجهر التبخر الميداني لرسم خريطة لموقع الذرات الفردية.
الحركية الدوائية
تُدرس حركية الدواء غالبًا باستخدام مطياف الكتلة نظرًا لطبيعة المصفوفة المعقدة (عادةً الدم أو البول) والحاجة إلى حساسية عالية لرصد بيانات الجرعات المنخفضة والفترات الزمنية الطويلة. يُعد جهاز كروماتوغرافيا السائل - مطياف الكتلة (LC-MS) المزود بمطياف كتلة رباعي الأقطاب ثلاثي الأكثر شيوعًا في هذا التطبيق . ويُستخدم مطياف الكتلة الترادفي عادةً لزيادة الدقة. تُستخدم منحنيات المعايرة والمعايير الداخلية لتحديد كمية دواء واحد عادةً في العينات. تمثل العينات نقاطًا زمنية مختلفة أثناء إعطاء الدواء ثم استقلابه أو التخلص منه من الجسم. تُعد عينات الفراغ (t=0) المأخوذة قبل الإعطاء مهمة لتحديد الخلفية وضمان سلامة البيانات مع هذه المصفوفات المعقدة للعينات. يُولى اهتمام كبير لخطية منحنى المعايرة؛ ومع ذلك، من الشائع استخدام مطابقة المنحنى بدوال أكثر تعقيدًا مثل الدوال التربيعية نظرًا لأن استجابة معظم مطيافات الكتلة تكون أقل من خطية عبر نطاقات تركيز واسعة. [ 65 ] [ 66 ] [ 67 ]
يوجد حاليًا اهتمام كبير باستخدام مطياف الكتلة عالي الحساسية للغاية لدراسات الجرعات الدقيقة ، والتي تعتبر بديلاً واعدًا للتجارب على الحيوانات .
تُشير الدراسات الحديثة إلى أن التأين بالرذاذ الكهربائي الثانوي (SESI) تقنية فعّالة لرصد حركية الأدوية عبر تحليل الزفير. [ 68 ] [ 69 ] ولأن الزفير يُنتج طبيعيًا، يُمكن جمع العديد من نقاط البيانات بسهولة، مما يُتيح زيادة عدد نقاط البيانات المُجمّعة بشكل كبير. [ 70 ] في الدراسات على الحيوانات، يُمكن لتقنية SESI هذه أن تُقلل من الحاجة إلى التضحية بالحيوانات. [ 69 ] أما في البشر، فيُمكن لتحليل الزفير غير الجراحي بتقنية SESI-MS أن يُساعد في دراسة حركية الأدوية على مستوى فردي. [ 68 ] [ 71 ] [ 72 ]
توصيف البروتين
Mass spectrometry is an important method for the characterization and sequencing of proteins. The two primary methods for ionization of whole proteins are electrospray ionization (ESI) and matrix-assisted laser desorption/ionization (MALDI). In keeping with the performance and mass range of available mass spectrometers, two approaches are used for characterizing proteins. In the first, intact proteins are ionized by either of the two techniques described above, and then introduced to a mass analyzer. This approach is referred to as "top-down" strategy of protein analysis. The top-down approach however is largely limited to low-throughput single-protein studies. In the second, proteins are enzymatically digested into smaller peptides using proteases such as trypsin or pepsin, either in solution or in gel after electrophoretic separation. Other proteolytic agents are also used. The collection of peptide products are often separated by chromatography prior to introduction to the mass analyzer. When the characteristic pattern of peptides is used for the identification of the protein the method is called peptide mass fingerprinting (PMF), if the identification is performed using the sequence data determined in tandem MS analysis it is called de novo peptide sequencing. These procedures of protein analysis are also referred to as the "bottom-up" approach, and have also been used to analyse the distribution and position of post-translational modifications such as phosphorylation on proteins.[73] A third approach is also beginning to be used, this intermediate "middle-down" approach involves analyzing proteolytic peptides that are larger than the typical tryptic peptide.[74]
Space exploration

As a standard method for analysis, mass spectrometers have reached other planets and moons. Two were taken to Mars by the Viking program. In early 2005 the Cassini–Huygens mission delivered a specialized GC-MS instrument aboard the Huygens probe through the atmosphere of Titan, the largest moon of the planet Saturn. This instrument analyzed atmospheric samples along its descent trajectory and was able to vaporize and analyze samples of Titan's frozen, hydrocarbon covered surface once the probe had landed. These measurements compare the abundance of isotope(s) of each particle comparatively to earth's natural abundance.[75] Also on board the Cassini–Huygens spacecraft was an ion and neutral mass spectrometer which had been taking measurements of Titan's atmospheric composition as well as the composition of Enceladus' plumes. A Thermal and Evolved Gas Analyzer mass spectrometer was carried by the Mars Phoenix Lander launched in 2007.[76]
Mass spectrometers are also widely used in space missions to measure the composition of plasmas. For example, the Cassini spacecraft carried the Cassini Plasma Spectrometer (CAPS),[77] which measured the mass of ions in Saturn's magnetosphere.
Respired gas monitor
Mass spectrometers were used in hospitals for respiratory gas analysis beginning around 1975 through the end of the century. Some are probably still in use but none are currently being manufactured.[78]
Found mostly in the operating room, they were a part of a complex system, in which respired gas samples from patients undergoing anesthesia were drawn into the instrument through a valve mechanism designed to sequentially connect up to 32 rooms to the mass spectrometer. A computer directed all operations of the system. The data collected from the mass spectrometer was delivered to the individual rooms for the anesthesiologist to use.
The uniqueness of this magnetic sector mass spectrometer may have been the fact that a plane of detectors, each purposely positioned to collect all of the ion species expected to be in the samples, allowed the instrument to simultaneously report all of the gases respired by the patient. Although the mass range was limited to slightly over 120 u, fragmentation of some of the heavier molecules negated the need for a higher detection limit.[79]
Preparative mass spectrometry
The primary function of mass spectrometry is as a tool for chemical analyses based on detection and quantification of ions according to their mass-to-charge ratio. However, mass spectrometry also shows promise for material synthesis.[61] Ion soft landing is characterized by deposition of intact species on surfaces at low kinetic energies which precludes the fragmentation of the incident species.[80] The soft landing technique was first reported in 1977 for the reaction of low energy sulfur containing ions on a lead surface.[81]
Charge detection mass spectrometry
Most mass spectrometers measure the mass-to-charge ratio; the actual mass can be found only if the charge is known. For smaller molecules the charge can be determined from the spacing of isotope peaks, but for very large biomolecules and particles (in the megadalton range) resolution may not be adequate to separate isotope peaks, and thus the mass cannot be determined. In charge detection mass spectrometry (CDMS), the charge of an individual ion/particle is measured directly (alongside its mass-to-charge ratio) and therefore the true mass is known. It is a single-particle technique, but to produce more precise and accurate results, the data from many individually-measured ions can be combined.[82][83]
See also
- Bioelectrospray
- Dumas method of molecular weight determination
- Evolved gas analysis
- Helium mass spectrometer
- Isotope dilution
- MassBank (database), a Japanese spectral database
- Mass spectrometry imaging
- Mass spectrometry software
- MasSpec Pen
- Micro-arrays for mass spectrometry
- Nanoscale secondary ion mass spectrometry
- Reflectron
References
- 123Sparkman, O. David (2000). Mass spectrometry desk reference. Pittsburgh: Global View Pub. ISBN 978-0-9660813-2-9.
- ↑"Definition of SPECTROGRAPH". Merriam Webster. June 9, 2026. Retrieved 2026-07-24.
- ↑Downard K (2004). Mass Spectrometry - A Foundation Course. Royal Society of Chemistry. doi:10.1039/9781847551306. ISBN 978-0-85404-609-6.
- ↑Squires G (1998). "Francis Aston and the mass spectrograph". Dalton Transactions (23): 3893–3900. doi:10.1039/a804629h.
- ↑Downard KM (2007). "Historical account: Francis William Aston: the man behind the mass spectrograph". European Journal of Mass Spectrometry. 13 (3): 177–90. doi:10.1255/ejms.878. PMID 17881785. S2CID 25747367.
- ↑Thomson JJ (1913). Rays Of Positive Electricity and Their Application to Chemical Analysis. London: Longman's Green and Company.
- ↑Siri W (1947). "Mass spectroscope for analysis in the low-mass range". Review of Scientific Instruments. 18 (8): 540–545. Bibcode:1947RScI...18..540S. doi:10.1063/1.1740998.
- ↑Price P (August 1991). "Standard definitions of terms relating to mass spectrometry : A report from the committee on measurements and standards of the American society for mass spectrometry". Journal of the American Society for Mass Spectrometry. 2 (4): 336–48. Bibcode:1991JASMS...2..336P. doi:10.1016/1044-0305(91)80025-3. PMID 24242353. S2CID 20236081.
- ↑Parkins WE (2005). "The uranium bomb, the calutron, and the space-charge problem". Physics Today. 58 (5): 45–51. Bibcode:2005PhT....58e..45P. CiteSeerX 10.1.1.579.4119. doi:10.1063/1.1995747. ISSN 0031-9228.
- ↑"The Nobel Prize in Chemistry 2002: Information for the Public". The Nobel Foundation. 9 October 2002. Retrieved 2007-08-29.
- 1234567891011121314151617181920212223242526Pavia DL, Lampman GM, Kriz GS, Vyvyan JR (2015). Introduction to spectroscopy (5th ed.). Stamford, CT: Cengage Learning. ISBN 978-1-285-46012-3.
- ↑Fenn JB, Mann M, Meng CK, Wong SF, Whitehouse CM (October 1989). "Electrospray ionization for mass spectrometry of large biomolecules". Science. 246 (4926): 64–71. Bibcode:1989Sci...246...64F. CiteSeerX 10.1.1.522.9458. doi:10.1126/science.2675315. PMID 2675315.
- ↑Tanaka K, Waki H, Ido Y, Akita S, Yoshida Y, Yoshida T (1988). "Protein and Polymer Analyses up to m/z 100 000 by Laser Ionization Time-of flight Mass Spectrometry". Rapid Commun Mass Spectrom. 2 (20): 151–3. Bibcode:1988RCMS....2..151T. doi:10.1002/rcm.1290020802.
- ↑Karas M, Bachman D, Bahr U, Hillenkamp F (1987). "Matrix-Assisted Ultraviolet Laser Desorption of Non-Volatile Compounds". Int J Mass Spectrom Ion Proc. 78: 53–68. Bibcode:1987IJMSI..78...53K. doi:10.1016/0168-1176(87)87041-6.
- ↑Northen TR, Yanes O, Northen MT, Marrinucci D, Uritboonthai W, Apon J, Golledge SL, Nordström A, Siuzdak G (October 2007). "Clathrate nanostructures for mass spectrometry". Nature. 449 (7165): 1033–1036. Bibcode:2007Natur.449.1033N. doi:10.1038/nature06195. ISSN 1476-4687. PMID 17960240. S2CID 4404703.
- ↑Osborn DL, Zou P, Johnsen H, Hayden CC, Taatjes CA, Knyazev VD, North SW, Peterka DS, Ahmed M, Leone SR (October 2008). "The multiplexed chemical kinetic photoionization mass spectrometer: a new approach to isomer-resolved chemical kinetics". The Review of Scientific Instruments (Submitted manuscript). 79 (10) 104103: 104103–104103–10. Bibcode:2008RScI...79j4103O. doi:10.1063/1.3000004. OSTI 953768. PMID 19044733. S2CID 25452748.
- ↑Bruins, A. P. (1991). "Mass spectrometry with ion sources operating at atmospheric pressure". Mass Spectrometry Reviews. 10 (1): 53–77. Bibcode:1991MSRv...10...53B. doi:10.1002/mas.1280100104.
- ↑Cottrell JS, Greathead RJ (1986). "Extending the Mass Range of a Sector Mass Spectrometer". Mass Spectrometry Reviews. 5 (3): 215–247. Bibcode:1986MSRv....5..215C. doi:10.1002/mas.1280050302.
- ↑"Gas Chromatography-Mass Spectrometry". American Chemical Society. National Historic Chemical Landmarks. 2019-06-08.
- ↑Guilhaus M (1998). "Principles and Instrumentation in Time-of-flight Mass Spectrometry"(PDF). Journal of Mass Spectrometry. 30 (11): 1519–1532. doi:10.1002/jms.1190301102. S2CID 9444467. Archived from the original(PDF) on 2018-02-06 – via Google Scholar.
- ↑Wollnik, H. (1993). "Time-of-flight mass analyzers". Mass Spectrometry Reviews. 12 (2): 89–114. Bibcode:1993MSRv...12...89W. doi:10.1002/mas.1280120202.
- ↑Syed SU, Maher S, Taylor S (December 2013). "Quadrupole mass filter operation under the influence of magnetic field". Journal of Mass Spectrometry. 48 (12): 1325–39. Bibcode:2013JMSp...48.1325S. doi:10.1002/jms.3293. PMID 24338888.
- ↑Maher S, Syed SU, Hughes DM, Gibson JR, Taylor S (August 2013). "Mapping the stability diagram of a quadrupole mass spectrometer with a static transverse magnetic field applied". Journal of the American Society for Mass Spectrometry. 24 (8): 1307–14. Bibcode:2013JASMS..24.1307M. doi:10.1007/s13361-013-0654-5. PMID 23720050. S2CID 45734248.
- ↑Paul W, Steinwedel H (1953). "Ein neues Massenspektrometer ohne Magnetfeld". Zeitschrift für Naturforschung A. 8 (7): 448–450. Bibcode:1953ZNatA...8..448P. doi:10.1515/zna-1953-0710. S2CID 96549388.
- ↑March RE (2000). "Quadrupole ion trap mass spectrometry: a view at the turn of the century". International Journal of Mass Spectrometry. 200 (1–3): 285–312. Bibcode:2000IJMSp.200..285M. doi:10.1016/S1387-3806(00)00345-6.
- ↑Schwartz JC, Senko MW, Syka JE (June 2002). "A two-dimensional quadrupole ion trap mass spectrometer". Journal of the American Society for Mass Spectrometry. 13 (6): 659–69. Bibcode:2002JASMS..13..659S. doi:10.1016/S1044-0305(02)00384-7. PMID 12056566. S2CID 26965687.
- ↑Lammert SA, Rockwood AA, Wang M, Lee ML, Lee ED, Tolley SE, Oliphant JR, Jones JL, Waite RW (July 2006). "Miniature toroidal radio frequency ion trap mass analyzer". Journal of the American Society for Mass Spectrometry. 17 (7): 916–922. Bibcode:2006JASMS..17..916L. doi:10.1016/j.jasms.2006.02.009. PMID 16697659. S2CID 45444397.
- ↑Snyder DT, Pulliam CJ, Ouyang Z, Cooks RG (January 2016). "Miniature and Fieldable Mass Spectrometers: Recent Advances". Analytical Chemistry. 88 (1): 2–29. Bibcode:2016AnaCh..88....2S. doi:10.1021/acs.analchem.5b03070. PMC 5364034. PMID 26422665.
- ↑Comisarow MB, Marshall AG (1974). "Fourier-transform ion cyclotron resonance spectroscopy". Chemical Physics Letters. 25 (2): 282–283. Bibcode:1974CPL....25..282C. doi:10.1016/0009-2614(74)89137-2.
- ↑Marshall AG, Hendrickson CL, Jackson GS (1998). "Fourier-transform ion cyclotron resonance mass spectrometry: a primer". Mass Spectrometry Reviews. 17 (1): 1–35. Bibcode:1998MSRv...17....1M. doi:10.1002/(SICI)1098-2787(1998)17:1<1::AID-MAS1>3.0.CO;2-K. PMID 9768511.
- ↑Hu Q, Noll RJ, Li H, Makarov A, Hardman M, Graham Cooks R (April 2005). "The Orbitrap: a new mass spectrometer". Journal of Mass Spectrometry. 40 (4): 430–43. Bibcode:2005JMSp...40..430H. doi:10.1002/jms.856. PMID 15838939.
- 123Smith DF, Podgorski DC, Rodgers RP, Blakney GT, Hendrickson CL (2018-02-06). "21 Tesla FT-ICR Mass Spectrometer for Ultrahigh-Resolution Analysis of Complex Organic Mixtures". Analytical Chemistry. 90 (3): 2041–2047. Bibcode:2018AnaCh..90.2041S. doi:10.1021/acs.analchem.7b04159. ISSN 0003-2700. PMID 29303558.
- ↑Xian F, Hendrickson CL, Marshall AG (2012-01-17). "High Resolution Mass Spectrometry". Analytical Chemistry. 84 (2): 708–719. Bibcode:2012AnaCh..84..708X. doi:10.1021/ac203191t. ISSN 0003-2700. PMID 22263633.
- ↑Marshall AG, Guan S (1996). "Advantages of High Magnetic Field for Fourier Transform Ion Cyclotron Resonance Mass Spectrometry". Rapid Communications in Mass Spectrometry. 10 (14): 1819–1823. Bibcode:1996RCMS...10.1819M. doi:10.1002/(SICI)1097-0231(199611)10:14<1819::AID-RCM686>3.0.CO;2-Z. ISSN 1097-0231.
- 12Shaw JB, Lin TY, Leach FE, Tolmachev AV, Tolić N, Robinson EW, Koppenaal DW, Paša-Tolić L (2016-12-01). "21 Tesla Fourier Transform Ion Cyclotron Resonance Mass Spectrometer Greatly Expands Mass Spectrometry Toolbox". Journal of the American Society for Mass Spectrometry. 27 (12): 1929–1936. Bibcode:2016JASMS..27.1929S. doi:10.1007/s13361-016-1507-9. PMID 27734325.
- ↑Bogdanov B, Smith RD (March 2005). "Proteomics by FTICR mass spectrometry: Top down and bottom up". Mass Spectrometry Reviews. 24 (2): 168–200. Bibcode:2005MSRv...24..168B. doi:10.1002/mas.20015. ISSN 0277-7037. PMID 15389855.
- ↑Repp J, Böhm C, Crespo López-Urrutia JR, Dörr A, Eliseev S, George S, Goncharov M, Novikov YN, Roux C, Sturm S, Ulmer S, Blaum K (2012-06-01). "PENTATRAP: a novel cryogenic multi-Penning-trap experiment for high-precision mass measurements on highly charged ions". Applied Physics B. 107 (4): 983–996. arXiv:1110.2919. Bibcode:2012ApPhB.107..983R. doi:10.1007/s00340-011-4823-6. ISSN 1432-0649.
- ↑Schüssler RX, Bekker H, Braß M, Cakir H, Crespo López-Urrutia JR, Door M, Filianin P, Harman Z, Haverkort MW, Huang WJ, Indelicato P, Keitel CH, König CM, Kromer K, Müller M (May 2020). "Detection of metastable electronic states by Penning trap mass spectrometry". Nature. 581 (7806): 42–46. arXiv:2005.04892. Bibcode:2020Natur.581...42S. doi:10.1038/s41586-020-2221-0. ISSN 1476-4687. PMID 32376960.
- ↑ دوبوا ف، نوخينموس ر، زينوبي ر، برونيل أ، ديبرون س، لو بييك ي (1999). "مقارنة بين كاشفات الأيونات إلى الفوتونات وكواشف الألواح الميكروية". الاتصالات السريعة في قياس الطيف الكتلي . 13 (9): 786-791 . Bibcode : 1999RCMS...13..786D . doi : 10.1002/(SICI)1097-0231(19990515)13:9 < 786::AID-RCM566 > 3.0.CO ; 2-3 .
- ↑ بارك إم إيه، كالهان جيه إتش، فيرتس إيه (1994). "كاشف حثي لقياس الطيف الكتلي بزمن الطيران". اتصالات سريعة في قياس الطيف الكتلي . 8 (4): 317-322 . Bibcode : 1994RCMS....8..317P . doi : 10.1002/rcm.1290080407 .
- ↑ بويد، روبرت ك. (1994). "تقنيات المسح المترابط لتحليل الطيف الكتلي المتسلسل باستخدام أجهزة التانديم-إن-سبيس". مراجعات قياس الطيف الكتلي . 13 ( 5-6 ): 359-410 . Bibcode : 1994MSRv...13..359B . doi : 10.1002/mas.1280130502 .
- ↑ بوش كيه إل. "مسرد مصطلحات مطياف الكتلة" (ملف PDF) . Waters.com . Waters . تم الاطلاع عليه بتاريخ 12 فبراير 2024 .
- 1 2 3 Xue J, Guijas C, Benton HP, Warth B, Siuzdak G (أكتوبر 2020). "قاعدة بيانات معايير METLIN MS 2 الجزيئية: مورد كيميائي وبيولوجي واسع النطاق" . Nature Methods . 17 (10): 953–954 . Bibcode : 2020NaMet..17..953X . doi : 10.1038/s41592-020-0942-5 . PMC 8802982. PMID 32839599. S2CID 221285246 .
- ↑ سميث، سي. أ.، أوميل، جي.، وانت، إي. جيه.، تشين، سي.، تراوجر، إس. أ.، براندون، تي. آر.، كوستوديو، دي. إي.، أباغيان، آر.، سيوزداك، جي. (ديسمبر 2005). " METLIN: قاعدة بيانات طيفية للكتلة الأيضية" . مراقبة الأدوية العلاجية . 27 (6): 747-751 . doi : 10.1097/01.ftd.0000179845.53213.39 . PMID 16404815. S2CID 14774455 .
- ↑Guijas C, Montenegro-Burke JR, Domingo-Almenara X, Palermo A, Warth B, Hermann G, Koellensperger G, Huan T, Uritboonthai W, Aisporna AE, Wolan DW, Spilker ME, Benton HP, Siuzdak G (March 2018). "METLIN: A Technology Platform for Identifying Knowns and Unknowns". Analytical Chemistry. 90 (5): 3156–3164. Bibcode:2018AnaCh..90.3156G. doi:10.1021/acs.analchem.7b04424. PMC 5933435. PMID 29381867.
- 12Heim W, Aisporna A, Hoang L, Benton HP, Siuzdak G (2023), "METLIN Tandem Mass Spectrometry and Neutral Loss Databases for the Identification of Microbial Natural Products and Other Chemical Entities", in Ivanisevic J, Giera M (eds.), A Practical Guide to Metabolomics Applications in Health and Disease: From Samples to Insights into Metabolism, Cham: Springer International Publishing, pp. 105–124, doi:10.1007/978-3-031-44256-8_5, ISBN 978-3-031-44256-8, retrieved 2024-03-27
- ↑Aisporna A, Webb B, Uritboonthai W, Hoang L, Billings EM, Hoang C, Plumb R, Siuzdak G (2025-10-28). "Adaptive Modeling of Tandem Mass Spectrometry Data: Creation of the METLIN 960K MRM Database". Analytical Chemistry. 97 (44): 24586–24595. Bibcode:2025AnaCh..9724586A. doi:10.1021/acs.analchem.5c04639. ISSN 0003-2700. PMC 12613142. PMID 41150651.
- ↑Hoang C, Uritboonthai W, Hoang L, Billings EM, Aisporna A, Nia FA, Derks RJ, Williamson JR, Giera M, Siuzdak G (2024-03-26). "Tandem Mass Spectrometry across Platforms". Analytical Chemistry. 96 (14): 5478–5488. Bibcode:2024AnaCh..96.5478H. doi:10.1021/acs.analchem.3c05576. ISSN 0003-2700. PMC 11007677. PMID 38529642.
- ↑Benton HP, Wong DM, Trauger SA, Siuzdak G (August 2008). "XCMS2: processing tandem mass spectrometry data for metabolite identification and structural characterization". Analytical Chemistry. 80 (16): 6382–9. Bibcode:2008AnaCh..80.6382B. doi:10.1021/ac800795f. PMC 2728033. PMID 18627180.
- ↑Eiceman, G.A. (2000). Gas Chromatography. In R.A. Meyers (Ed.), Encyclopedia of Analytical Chemistry: Applications, Theory, and Instrumentation, pp. 10627. Chichester: Wiley. ISBN 0-471-97670-9
- ↑Fang M, Ivanisevic J, Benton HP, Johnson CH, Patti GJ, Hoang LT, Uritboonthai W, Kurczy ME, Siuzdak G (November 2015). "Thermal Degradation of Small Molecules: A Global Metabolomic Investigation". Analytical Chemistry. 87 (21): 10935–41. Bibcode:2015AnaCh..8710935F. doi:10.1021/acs.analchem.5b03003. PMC 4633772. PMID 26434689.
- ↑Loo JA, Udseth HR, Smith RD (June 1989). "Peptide and protein analysis by electrospray ionization-mass spectrometry and capillary electrophoresis-mass spectrometry". Analytical Biochemistry. 179 (2): 404–12. doi:10.1016/0003-2697(89)90153-X. PMID 2774189.
- ↑Maxwell EJ, Chen DD (October 2008). "Twenty years of interface development for capillary electrophoresis-electrospray ionization-mass spectrometry". Analytica Chimica Acta. 627 (1): 25–33. Bibcode:2008AcAC..627...25M. doi:10.1016/j.aca.2008.06.034. PMID 18790125.
- ↑Verbeck GF, Ruotolo BT, Sawyer HA, Gillig KJ, Russell DH (June 2002). "A fundamental introduction to ion mobility mass spectrometry applied to the analysis of biomolecules". Journal of Biomolecular Techniques. 13 (2): 56–61. PMC 2279851. PMID 19498967.
- ↑Matz LM, Asbury GR, Hill HH (2002). "Two-dimensional separations with electrospray ionization ambient pressure high-resolution ion mobility spectrometry/quadrupole mass spectrometry". Rapid Communications in Mass Spectrometry. 16 (7): 670–5. Bibcode:2002RCMS...16..670M. doi:10.1002/rcm.623. PMID 11921245.
- ↑Sowell RA, Koeniger SL, Valentine SJ, Moon MH, Clemmer DE (September 2004). "Nanoflow LC/IMS-MS and LC/IMS-CID/MS of protein mixtures". Journal of the American Society for Mass Spectrometry. 15 (9): 1341–53. Bibcode:2004JASMS..15.1341S. doi:10.1016/j.jasms.2004.06.014. PMID 15337515. S2CID 11531292.
- ↑Tureček F, McLafferty FW (1993). Interpretation of mass spectra. Sausalito: University Science Books. ISBN 978-0-935702-25-5.
- ↑Mistrik R. "A New Concept for the Interpretation of Mass Spectra Based on a Combination of a Fragmentation Mechanism Database and a Computer Expert System". Highchem.com. Archived from the original on 11 January 2012.
- ↑Sheldon MT, Mistrik R, Croley TR (March 2009). "Determination of ion structures in structurally related compounds using precursor ion fingerprinting". Journal of the American Society for Mass Spectrometry. 20 (3): 370–6. Bibcode:2009JASMS..20..370S. doi:10.1016/j.jasms.2008.10.017. PMID 19041260.
- ↑Zhou B, Xiao JF, Tuli L, Ressom HW (2012). "LC-MS-based metabolomics". Mol. BioSyst. 8 (2): 470–481. doi:10.1039/c1mb05350g. ISSN 1742-206X. PMC 3699692. PMID 22041788.
- 12Maher S, Jjunju FP, Taylor S (2015). "100 years of mass spectrometry: Perspectives and future trends". Rev. Mod. Phys. 87 (1): 113–135. Bibcode:2015RvMP...87..113M. doi:10.1103/RevModPhys.87.113.
- ↑ شيفيلا د، ميسينجر ج (نوفمبر 2013). "دراسة أكسدة الماء إلى أكسجين جزيئي في الأنظمة الضوئية والاصطناعية باستخدام مطياف الكتلة ذي المدخل الغشائي المُحَلَّل زمنيًا" . مجلة فرونتيرز إن بلانت ساينس . 4 : 473. Bibcode : 2013FrPS....4..473S . doi : 10.3389/fpls.2013.00473 . PMC 3840314. PMID 24324477 .
- ↑ لي إكس، هوانغ إل، تشو إتش، تشو زد (فبراير 2017). "التحليل المباشر لنَفَس الإنسان باستخدام مطياف الكتلة فائق الدقة بتقنية التأين بالرذاذ النانوي الثانوي: أهمية دقة الكتلة العالية ووضوحها". الاتصالات السريعة في مطياف الكتلة . 31 (3): 301-308 . Bibcode : 2017RCMS...31..301L . doi : 10.1002/rcm.7794 . PMID 27859758 .
- ↑ باريوس-كولادو، سي.، فيدال-دي-ميغيل، جي.، مارتينيز-لوزانو سينوس، بي. (فبراير 2016). "النمذجة العددية والتحقق التجريبي من مصدر تأين الرذاذ الكهربائي الثانوي العالمي لتحليل الغازات باستخدام مطياف الكتلة في الوقت الحقيقي" . أجهزة الاستشعار والمحركات ب: الكيميائية . 223 : 217-225 . Bibcode : 2016SeAcB.223..217B . doi : 10.1016/j.snb.2015.09.073 . hdl : 20.500.11850/105470 .
- ↑ هسيه واي، كورفماخر دبليو إيه (يونيو 2006). "زيادة السرعة والإنتاجية عند استخدام أنظمة HPLC-MS/MS لفحص استقلاب الأدوية والحركية الدوائية". مجلة Current Drug Metabolism . 7 (5): 479-489 . doi : 10.2174/138920006777697963 . PMID 16787157. S2CID 13612670 .
- ↑ كوفي تي آر، لي إي دي، هينيون جيه دي (أكتوبر 1986). "الكروماتوغرافيا السائلة عالية السرعة/مطياف الكتلة الترادفي لتحديد الأدوية في العينات البيولوجية". الكيمياء التحليلية . 58 (12): 2453-2460 . Bibcode : 1986AnaCh..58.2453C . doi : 10.1021/ac00125a022 . PMID 3789400 .
- ↑Covey TR, Crowther JB, Dewey EA, Henion JD (February 1985). "Thermospray liquid chromatography/mass spectrometry determination of drugs and their metabolites in biological fluids". Analytical Chemistry. 57 (2): 474–81. Bibcode:1985AnaCh..57..474C. doi:10.1021/ac50001a036. PMID 3977076.
- 12Gamez G, Zhu L, Disko A, Chen H, Azov V, Chingin K, Krämer G, Zenobi R (May 2011). "Real-time, in vivo monitoring and pharmacokinetics of valproic acid via a novel biomarker in exhaled breath". Chemical Communications. 47 (17): 4884–6. doi:10.1039/c1cc10343a. PMID 21373707.
- 12Li X, Martinez-Lozano Sinues P, Dallmann R, Bregy L, Hollmén M, Proulx S, Brown SA, Detmar M, Kohler M, Zenobi R (June 2015). "Drug Pharmacokinetics Determined by Real-Time Analysis of Mouse Breath". Angewandte Chemie. 54 (27): 7815–8. Bibcode:2015ACIE...54.7815L. doi:10.1002/anie.201503312. hdl:20.500.11850/102558. PMID 26015026.
- ↑Gaugg MT, Engler A, Nussbaumer-Ochsner Y, Bregy L, Stöberl AS, Gaisl T, Bruderer T, Zenobi R, Kohler M, Martinez-Lozano Sinues P (September 2017). "Metabolic effects of inhaled salbutamol determined by exhaled breath analysis". Journal of Breath Research. 11 (4): 046004. Bibcode:2017JBR....11d6004G. doi:10.1088/1752-7163/aa7caa. hdl:20.500.11850/220016. PMID 28901297.
- ↑Martinez-Lozano Sinues P, Kohler M, Brown SA, Zenobi R, Dallmann R (February 2017). "Gauging circadian variation in ketamine metabolism by real-time breath analysis". Chemical Communications. 53 (14): 2264–2267. doi:10.1039/C6CC09061C. PMID 28150005.
- ↑Tejero Rioseras A, Singh KD, Nowak N, Gaugg MT, Bruderer T, Zenobi R, Sinues PM (June 2018). "Real-Time Monitoring of Tricarboxylic Acid Metabolites in Exhaled Breath". Analytical Chemistry. 90 (11): 6453–6460. Bibcode:2018AnaCh..90.6453T. doi:10.1021/acs.analchem.7b04600. PMID 29767961.
- ↑Ferries S, Perkins S, Brownridge PJ, Campbell A, Eyers PA, Jones AR, Eyers CE (September 2017). "Evaluation of Parameters for Confident Phosphorylation Site Localization Using an Orbitrap Fusion Tribrid Mass Spectrometer". Journal of Proteome Research. 16 (9): 3448–3459. doi:10.1021/acs.jproteome.7b00337. PMID 28741359.
- ↑Chait BT (2011). "Mass spectrometry in the postgenomic era". Annual Review of Biochemistry. 80: 239–46. doi:10.1146/annurev-biochem-110810-095744. PMID 21675917. S2CID 2676180. – via Annual Reviews (subscription required)
- ↑Petrie S, Bohme DK (2007). "Ions in space". Mass Spectrometry Reviews. 26 (2): 258–80. Bibcode:2007MSRv...26..258P. doi:10.1002/mas.20114. PMID 17111346.
- ↑Hoffman JH, Chaney RC, Hammack H (October 2008). "Phoenix Mars Mission--the thermal evolved gas analyzer". Journal of the American Society for Mass Spectrometry. 19 (10): 1377–83. Bibcode:2008JASMS..19.1377H. doi:10.1016/j.jasms.2008.07.015. PMID 18715800.
- ↑"Cassini Plasma Spectrometer". Southwest Research Institute. Archived from the original on 2018-10-08. Retrieved 2008-01-04.
- ↑Riker JB, Haberman B (1976). "Expired gas monitoring by mass spectrometry in a respiratory intensive care unit". Critical Care Medicine. 4 (5): 223–9. doi:10.1097/00003246-197609000-00002. PMID 975846. S2CID 6334599.
- ↑Gothard JW, Busst CM, Branthwaite MA, Davies NJ, Denison DM (September 1980). "Applications of respiratory mass spectrometry to intensive care". Anaesthesia. 35 (9): 890–5. doi:10.1111/j.1365-2044.1980.tb03950.x. PMID 6778243. S2CID 41696370.
- ↑Verbeck G, Hoffmann W, Walton B (October 2012). "Soft-landing preparative mass spectrometry". The Analyst. 137 (19): 4393–407. Bibcode:2012Ana...137.4393V. doi:10.1039/C2AN35550G. PMID 22900257.
- ↑Franchetti V, Solka BH, Baitinger WE, Amy JW, Cooks RG (1977). "Soft landing of ions as a means of surface modification". Mass Spectrom. Ion Phys. 23 (1): 29–35. Bibcode:1977IJMSI..23...29F. doi:10.1016/0020-7381(77)80004-1.
- ↑Jarrold MF (2022). "Applications of Charge Detection Mass Spectrometry in Molecular Biology and Biotechnology". Chemical Reviews. 122 (8): 7415–7441. doi:10.1021/acs.chemrev.1c00377. PMC 10842748. PMID 34637283.
- ↑Rathore AS (2022). "Charge Detection Mass Spectrometry: What's the "Big" Deal?". LCGC North America. 40 (3): 125–127. doi:10.56530/lcgc.na.gp8165g1. Retrieved 19 August 2025.
Bibliography
- Tureček F, McLafferty FW (1993). Interpretation of mass spectra. Sausalito, Calif: University Science Books. ISBN 978-0-935702-25-5.
- de Hoffman E, Stroobant V (2001). Mass Spectrometry: Principles and Applications (2nd ed.). John Wiley and Sons. ISBN 978-0-471-48566-7.
- Downard K (2004). Mass Spectrometry – A Foundation Course. Cambridge UK: Royal Society of Chemistry. ISBN 978-0-85404-609-6.
- Siuzdak G (1996). Mass spectrometry for biotechnology. Boston: Academic Press. ISBN 978-0-12-647471-8.
- Dass C (2001). Principles and practice of biological mass spectrometry. New York: John Wiley. ISBN 978-0-471-33053-0.
- Muzikar P, et al. (2003). "Accelerator Mass Spectrometry in Geologic Research". Geological Society of America Bulletin. 115: 643–654. Bibcode:2003GSAB..115..643M. doi:10.1130/0016-7606(2003)115<0643:AMSIGR>2.0.CO;2. ISSN 0016-7606. S2CID 55076131.
- Maher S, Jjunju FP, Taylor S (2015). "100 years of mass spectrometry: Perspectives and future trends". Rev. Mod. Phys. 87 (1): 113–135. Bibcode:2015RvMP...87..113M. doi:10.1103/RevModPhys.87.113.
- Sobott F (2014). Biological Mass Spectrometry. Boca Raton: Crc Pr I Llc. ISBN 978-1-4398-9527-6.
- Sparkman OD (2006). Mass Spectrometry Desk Reference. Pittsburgh: Global View Pub. ISBN 978-0-9660813-9-8.
- Watson JT, Sparkman OD (2007). Introduction to Mass Spectrometry: Instrumentatio, Applications, and Strategies for Data Interpretation (4th ed.). Chichester: Jonh Wiley & Sons. ISBN 978-0-470-51634-8.
- Tuniz C (1998). Accelerator mass spectrometry: ultrasensitive analysis for global science. Boca Raton: CRC Press. ISBN 978-0-8493-4538-8.
- Kandiah M, Urban PL (June 2013). "Advances in ultrasensitive mass spectrometry of organic molecules". Chemical Society Reviews. 42 (12): 5299–322. doi:10.1039/c3cs35389c. PMID 23471277.
- Calmes J (2011). Mass spec : the biography of a scientific instrument (MS). Massachusetts Instite of Technology. hdl:1721.1/68473.
External links
- Interactive tutorial on mass spectra National High Magnetic Field Laboratory
- Mass spectrometer simulation An interactive application simulating the console of a mass spectrometer
- أداة محاكاة أطياف الكتلة في الوقت الفعلي لمحاكاة أطياف الكتلة في المتصفح
- مطياف الكتلة
- الكيمياء السريرية
- أجهزة قياس الطيف
- أدوات القياس
- الأدوات العلمية
- التقنيات العلمية
- علم الأمراض السريري