
التركيبة السكانية لألمانيا


| سنة | بوب. | ±% سنتيمتر مكعب |
|---|---|---|
| 1500 | 9,200,000 | — |
| 1550 | 12,900,000 | +0.68% |
| 1600 | 16,200,000 | +0.46% |
| 1650 | 10,000,000 | -0.96% |
| 1700 | 14,100,000 | +0.69% |
| 1750 | 18,300,000 | +0.52% |
| 1800 | 22,700,000 | +0.43% |
| 1850 | 35,303,000 | +0.89% |
| 1870 | 40,804,000 | +0.73% |
| 1900 | 56,046,000 | +1.06% |
| 1910 | 64,568,000 | +1.43% |
| 1920 | 61,974,000 | -0.41% |
| 1930 | 64,294,000 | +0.37% |
| 1940 | 69,838,000 | +0.83% |
| 1950 | 69,346,000 | -0.07% |
| 1960 | 73,147,000 | +0.54% |
| 1970 | 78,069,000 | +0.65% |
| 1980 | 78,397,000 | +0.04% |
| 1990 | 79,753,227 | +0.17% |
| 2000 | 82,259,540 | +0.31% |
| 2010 | 81,751,602 | -0.06% |
| 2020 | 83,155,031 | +0.17% |
| 2025 | 83,467,117 | +0.07% |
| المصدر: DESTATIS (بعد عام 1950)، Histat (حدود الرايخ 1850-1940)، [ 7 ] جمعية ماكس بلانك (حدود الرايخ 1500-1840 (بما في ذلك Als.-Lor.)) [ 8 ] | ||
يتولى المكتب الاتحادي للإحصاء في ألمانيا رصد التركيبة السكانية . ووفقًا لأحدث البيانات، بلغ عدد سكان ألمانيا 83,467,117 نسمة (حتى 31 ديسمبر 2025) [ 1 ]، مما يجعلها الدولة الأكثر اكتظاظًا بالسكان في الاتحاد الأوروبي ، والتاسعة عشرة عالميًا. وبلغ معدل الخصوبة الإجمالي 1.32 في عام 2025 [ 9 ] ، وهو أقل بكثير من معدل الإحلال البالغ 2.1. وتُعد ألمانيا من بين الدول ذات أدنى معدلات الخصوبة في العالم، حيث تتراوح بين 1.3 و1.4 منذ ثمانينيات القرن الماضي [ 10 ] . وبسبب انخفاض معدل المواليد، سجلت ألمانيا وفيات أكثر من المواليد سنويًا منذ عام 1972 [ 11 ] ، مما يعني أن عام 2025 كان العام الرابع والخمسين على التوالي الذي كان من الممكن أن ينخفض فيه عدد سكان ألمانيا لولا الهجرة. ومع ذلك، وبسبب الهجرة، ازداد عدد السكان فعليًا بنحو خمسة ملايين نسمة خلال نصف القرن الماضي. في عام 2025، بلغ عدد الأشخاص ذوي الخلفية الأجنبية حوالي 31٪؛ [ 12 ] وتشمل هذه الفئة الأجانب والمواطنين المجنسين والعائدين من أصول ألمانية من أوروبا الشرقية وأبناء جميع الفئات المذكورة أعلاه.
حتى أوائل القرن العشرين، كانت ألمانيا أيضًا دولة مهاجرة رئيسية؛ ففي القرن التاسع عشر، هاجر أكثر من 5 ملايين مواطن من الإمبراطورية الألمانية إلى الولايات المتحدة وحدها ، وفي أوائل القرن العشرين، خسرت ألمانيا مليوني مهاجر آخرين لصالح الولايات المتحدة، بالإضافة إلى أعداد كبيرة هاجرت إلى أمريكا اللاتينية وكندا وأوروبا الشرقية. ومع ذلك، بعد الحرب العالمية الثانية، بدأت الهجرة تفوق الهجرة الخارجية، حيث طُرد حوالي 14 مليون ألماني من أصول عرقية من المقاطعات الشرقية السابقة للرايخ ومناطق أخرى في أوروبا الشرقية. من بين هؤلاء، وصل ما يقرب من 12 مليونًا إلى ألمانيا الحالية، واستقر مئات الآلاف في النمسا ودول أخرى، بينما توفي مئات الآلاف. كما عاد حوالي 4.5 مليون ألماني من أصول عرقية من أوروبا الشرقية إلى وطنهم بعد عام 1950، وخاصة مع نهاية الكتلة الشرقية ، ومعظمهم من الاتحاد السوفيتي السابق وبولندا ورومانيا. [ 13 ] [ 14 ]
بدأت الهجرة واسعة النطاق إلى ألمانيا الغربية خلال فترة المعجزة الاقتصادية (Wirtschaftswunder) من خمسينيات القرن العشرين وحتى أوائل سبعينياته، عندما عانت ألمانيا من نقص في العمالة، فسمحت بدخول سكان جنوب أوروبا من دول مثل تركيا وإيطاليا وإسبانيا بشكل مؤقت كعمالة وافدة . وقد أتاح تحرير قوانين العمالة الوافدة للكثيرين البقاء وبناء حياة في ألمانيا الغربية . وشهدت ألمانيا موجة هجرة كبيرة أخرى مع نهاية القرن العشرين، مدفوعة بإعادة توحيد ألمانيا ، وتدفق اللاجئين من حروب يوغوسلافيا ، وأعداد كبيرة من المواطنين الأتراك الذين يسعون للجوء . وبدأت موجة الهجرة الكبيرة التالية بعد توسع الاتحاد الأوروبي شرقًا عام 2011، حيث سُمح لسكان أوروبا الشرقية بالعيش والعمل في ألمانيا دون تأشيرة. وخلال أزمة المهاجرين الأوروبية عام 2015، استقبلت ألمانيا عددًا كبيرًا من اللاجئين، سواء من حيث العدد المطلق أو نسبةً إلى الدول الأعضاء الأخرى في الاتحاد الأوروبي. سجلت البلاد 476,649 طالب لجوء في عام 2015، و745,545 في عام 2016، ثم انخفضت الأعداد بعد ذلك. [ 15 ]
تتمتع ألمانيا بواحد من أعلى مستويات التعليم والتطور التكنولوجي والإنتاجية الاقتصادية في العالم. فمنذ نهاية الحرب العالمية الثانية ، تضاعف عدد الطلاب الملتحقين بالجامعات أكثر من ثلاث مرات، وتُعدّ مدارسها المهنية والتقنية من بين الأفضل عالميًا. وبمتوسط دخل للفرد يبلغ حوالي 40,883 يورو في عام 2018، [ 16 ] تُصنّف ألمانيا كمجتمع متوسط الدخل. مع ذلك، شهدت البلاد ارتفاعًا ملحوظًا في عدد الأطفال الذين يعيشون في فقر . ففي عام 1965، كان طفل واحد من بين كل 75 طفلًا مُسجّلًا في قوائم الرعاية الاجتماعية، ولكن بحلول عام 2007، ارتفع هذا الرقم إلى طفل واحد من بين كل ستة أطفال. يعيش هؤلاء الأطفال في فقر نسبي، ولكن ليس بالضرورة في فقر مُطلق. [ 17 ] يسافر ملايين الألمان إلى الخارج سنويًا. ويُوفّر نظام الرعاية الاجتماعية الرعاية الصحية الشاملة ، وتعويضات البطالة ، وإعانات الأطفال ، وغيرها من البرامج الاجتماعية. أدى شيخوخة السكان في ألمانيا واقتصادها المتعثر إلى إجهاد نظام الرعاية الاجتماعية في التسعينيات، مما أدى إلى تبني الحكومة لبرنامج واسع النطاق من الإصلاحات المثيرة للجدل لتقليص الإنفاق، وهو برنامج أجندة 2010 ، بما في ذلك إصلاحات سوق العمل المعروفة باسم مفهوم هارتز .
تاريخ
1945–1990
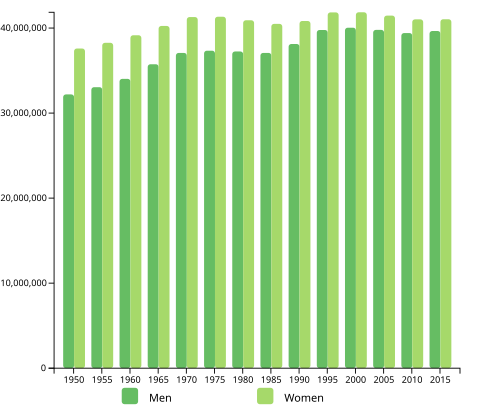
بعد التغييرات الحدودية وعمليات الطرد التي شهدتها الحرب العالمية الثانية ، انتقل الألمان من وسط وشرق أوروبا والمناطق الشرقية السابقة غربًا إلى ألمانيا ما بعد الحرب . وخلال تقسيم ألمانيا، فرّ العديد من الألمان من ألمانيا الشرقية إلى ألمانيا الغربية لأسباب سياسية واقتصادية. ومنذ إعادة توحيد ألمانيا، لا تزال هناك هجرات مستمرة من الولايات الشرقية الجديدة ( نيو لاندر) إلى الولايات الغربية القديمة (أولد لاندر) لأسباب اقتصادية.
اتبعت جمهورية ألمانيا الاتحادية وجمهورية ألمانيا الديمقراطية مسارين مختلفين فيما يتعلق بالتركيبة السكانية. فقد كانت سياسات جمهورية ألمانيا الديمقراطية مؤيدة للزيادة السكانية [ 18 ]، بينما كانت سياسات جمهورية ألمانيا الاتحادية تعويضية.
كان معدل الخصوبة في ألمانيا الشرقية أعلى منه في ألمانيا الغربية. ولم تكن السياسة الديموغرافية سوى أحد الأسباب. فقد كانت خيارات النساء في ألمانيا الشرقية محدودة فيما يتعلق بظروفهن الشخصية، وكان يُتوقع منهن الإنجاب في سن مبكرة. كما كانت رعاية الأطفال المجانية التي تمولها الدولة متاحة لجميع الأمهات. [ 19 ]
| سنة | 1960 | 1970 | 1980 | 1985 | 2002 | 2008 |
|---|---|---|---|---|---|---|
| ألمانيا الغربية | 24.9 | 23.8 | 25.0 | 26.2 | 27.6 | 28.7 |
| ألمانيا الشرقية | 23.0 | 22.5 | 22.3 | 22.3 | 26.4 | 27.5 |
ملاحظة: تم إدراج برلين ضمن ألمانيا الشرقية في عامي 2002 و2008. المصدر: كريينفيلد (2002)؛ كريينفيلد وآخرون (2010)؛ وزارة التنمية الاقتصادية الألمانية (2010) [ 20 ]
1990–اليوم
غادر حوالي 1.7 مليون شخص الولايات الفيدرالية الجديدة (الشرق) منذ سقوط جدار برلين، أو 12٪ من السكان؛ [ 21 ] وكان عدد كبير بشكل غير متناسب منهم من النساء دون سن 35. [ 22 ]
بعد عام 1990، انخفض معدل الخصوبة الكلي في الشرق إلى 0.772 في عام 1994. ويعزى ذلك إلى "صدمة ديموغرافية": لم يقتصر الأمر على انخفاض عدد الأطفال الذين أنجبهم الناس، بل انخفضت أيضًا احتمالية زواجهم أو طلاقهم بعد نهاية ألمانيا الشرقية؛ إذ ازدادت الخيارات المتاحة أمام مواطني ألمانيا الشرقية السابقة. وبدا أن الأمومة في سن مبكرة أقل جاذبية، وارتفع سن الإنجاب الأول بشكل حاد. [ 19 ]
في السنوات اللاحقة، بدأ معدل الخصوبة الكلي في الشرق بالارتفاع مجددًا، متجاوزًا 1.0 في عام 1997 و1.3 في عام 2004، ووصل إلى معدل الخصوبة الكلي في الغرب (1.37) في عام 2007. وفي عام 2010، تجاوز معدل الخصوبة في الشرق (1.459) نظيره في الغرب (1.385) بشكل واضح، بينما ارتفع معدل الخصوبة الكلي في ألمانيا إلى 1.393، وهو أعلى مستوى له منذ عام 1990، [ 23 ] [ 24 ] والذي كان لا يزال أقل بكثير من معدل الإحلال الطبيعي البالغ 2.1 ومعدلات المواليد التي كانت سائدة في ظل الشيوعية. وفي عام 2016، بلغ معدل الخصوبة الكلي 1.64 في الشرق و1.60 في الغرب. [ 25 ]
بين عامي 1989 و 2009، أُغلقت حوالي 2000 مدرسة بسبب انخفاض عدد الأطفال. [ 21 ]
في بعض المناطق انخفض عدد النساء بين سن 20 و 30 عامًا بأكثر من 30٪. [ 21 ] في عام 2004، في الفئة العمرية 18-29 (ذات الأهمية الإحصائية لتكوين الأسر) كان هناك 90 امرأة فقط لكل 100 رجل في الولايات الفيدرالية الجديدة (الشرق، بما في ذلك برلين).
حتى عام ٢٠٠٧، كانت سياسات الأسرة في الجمهورية الاتحادية تعويضية، ما يعني أن الأسر الفقيرة كانت تحصل على إعانات أسرية أكبر (مثل إعانة الأطفال ) من الأسر الغنية. وفي عام ٢٠٠٧، تم استحداث ما يُسمى بإعانة الوالدين . ووفقًا لكريستوف باترويغ، كان الهدف من إعانة الوالدين هو "تحفيز النساء ذوات التعليم العالي على إنجاب المزيد من الأطفال"؛ في المقابل، تضرر الفقراء من هذه الإعانة ، وأصبحوا يحصلون على إعانات أطفال أقل من الطبقة المتوسطة. [ ٢٦ ] أما الميسورون جدًا (الذين يكسبون أكثر من ٢٥٠ ألف يورو سنويًا) والمستفيدون من الرعاية الاجتماعية فلا يحصلون على أي مدفوعات من إعانة الوالدين. [ ٢٧ ]
في عام 2013 لوحظت التطورات الأخيرة التالية: [ 28 ]
- ارتفع دخل الأسر التي لديها أطفال صغار. وكان الأشخاص الحاصلون على شهادة جامعية، والأشخاص الذين تزيد أعمارهم عن 30 عامًا، والآباء الذين لديهم طفل واحد فقط، هم الأكثر استفادة. أما الآباء العازبون والآباء الشباب فلم يستفيدوا.
- أصبح الآباء أكثر انخراطاً في تربية الأطفال، ويأخذ 28% منهم الآن إجازة من العمل (3.3 أشهر في المتوسط) عند ولادة أطفالهم.
- أصبحت الأمهات أكثر عرضة للعمل، وبالتالي أقل عرضة للحرمان الاقتصادي مما كن عليه في السابق.
- ارتفع معدل المواليد بين النساء الحاصلات على شهادات جامعية.
في الولايات الفيدرالية الجديدة، أصبح معدل الخصوبة لدى النساء الحاصلات على شهادات جامعية أعلى من معدل الخصوبة لدى النساء غير الحاصلات على شهادات جامعية. وتُناقش الاختلافات في أولويات القيم وتوفر خدمات رعاية الأطفال بشكل أفضل في الولايات الشرقية كأسباب محتملة لذلك. [ 29 ]
في عام 2019، نشر المعهد النمساوي غير الربحي للأبحاث الاقتصادية ومؤسسة بيرتلسمان دراسة حول الأثر الاقتصادي للتغيرات الديموغرافية. ويفترض الباحثون انخفاضًا في متوسط دخل الفرد بمقدار 3700 يورو حتى عام 2040. [ 30 ]
سكان

كانت التركيبة السكانية المعاصرة لألمانيا تُقاس سابقًا بسلسلة من التعدادات السكانية الشاملة التي تفرضها الدولة، وكان آخرها عام 1987. ومنذ إعادة التوحيد، تعتمد السلطات الألمانية على تعداد سكاني مصغر . إحصاءات سكانية وفقًا لمراجعة السكان العالمية. [ 31 ] ونظرًا لمخاوف السكان الألمان بشأن الخصوصية بعد إعادة التوحيد، لم تُجرِ ألمانيا تعدادًا سكانيًا دوريًا حتى التعداد الألماني لعام 2011 الذي فرضه الاتحاد الأوروبي . قوبل هذا الشرط برفض واسع. وبناءً على متطلبات الاتحاد الأوروبي، تواصل ألمانيا الآن إجراء تعدادات سكانية كل 10 سنوات. [ 32 ]
- ولادة واحدة كل 43 ثانية
- حالة وفاة واحدة كل 34 ثانية
- مكسب صافٍ لشخص واحد كل 4 دقائق
- مهاجر واحد كل دقيقتين
عرض بيانات المصدر .
عرض بيانات المصدر .
عرض بيانات المصدر .
عرض بيانات المصدر .
خصوبة

معدل الخصوبة الكلي هو عدد الأطفال الذين تنجبهم كل امرأة. وهو يستند إلى بيانات جيدة نسبياً تغطي الفترة الزمنية بأكملها. المصادر: Our World In Data ومؤسسة Gapminder . [ 34 ]
| سنة | خصوبة |
|---|---|
| 1800 | 5.4 |
| 1801 | 5.40 |
| 1802 | 5.39 |
| 1803 | |
| 1804 | 5.38 |
| 1805 | |
| 1806 | 5.37 |
| 1807 | |
| 1808 | 5.36 |
| 1809 | |
| 1810 | 5.35 |
| 1811 | |
| 1812 | 5.34 |
| 1813 | |
| 1814 | 5.33 |
| 1815 | |
| 1816 | 5.32 |
| 1817 | |
| 1818 | 5.33 |
| 1819 | 5.35 |
| 1820 | 5.37 |
| 1821 | 5.35 |
| 1822 | 5.33 |
| 1823 | 5.31 |
| 1824 | 5.28 |
| 1825 | 5.26 |
| 1826 | 5.17 |
| 1827 | 5.07 |
| 1828 | 4.97 |
| 1829 | 4.88 |
| 1830 | 4.78 |
| 1831 | 4.80 |
| 1832 | 4.83 |
| 1833 | 4.85 |
| 1834 | 4.88 |
| 1835 | 4.9 |
| 1836 | |
| 1837 | |
| 1838 | |
| 1839 | |
| 1840 | |
| 1841 | |
| 1842 | 4.95 |
| 1843 | 4.97 |
| 1844 | 5.00 |
| 1845 | 5.02 |
| 1846 | |
| 1847 | |
| 1848 | 5.01 |
| 1849 | |
| 1850 | |
| 1851 | 4.87 |
| 1852 | 4.74 |
| 1853 | 4.60 |
| 1854 | 4.47 |
| 1855 | 4.33 |
| 1856 | 4.45 |
| 1857 | 4.56 |
| 1858 | 4.67 |
| 1859 | 4.79 |
| 1860 | 4.90 |
| 1861 | 4.93 |
| 1862 | 4.96 |
| 1863 | 5.00 |
| 1864 | 5.03 |
| 1865 | 5.06 |
| 1866 | 5.09 |
| 1867 | 5.11 |
| 1868 | 5.13 |
| 1869 | 5.16 |
| 1870 | 5.18 |
| 1871 | 5.24 |
| 1872 | 5.30 |
| 1873 | 5.35 |
| 1874 | 5.41 |
| 1875 | 5.46 |
| 1876 | 5.38 |
| 1877 | 5.30 |
| 1878 | 5.22 |
| 1879 | 5.14 |
| 1880 | 5.06 |
| 1881 | 5.14 |
| 1882 | 5.21 |
| 1883 | 5.29 |
| 1884 | 5.28 |
| 1885 | 5.26 |
| 1886 | 5.25 |
| 1887 | 5.23 |
| 1888 | 5.22 |
| 1889 | 5.21 |
| 1890 | 5.20 |
| 1891 | 5.18 |
| 1892 | 5.17 |
| 1893 | 5.16 |
| 1894 | 5.14 |
| 1895 | 5.11 |
| 1896 | 5.09 |
| 1897 | 5.06 |
| 1898 | 5.04 |
| 1899 | 4.99 |
متوسط العمر المتوقع
المصادر: Our World In Data والأمم المتحدة .


| سنة | متوسط العمر المتوقع |
|---|---|
| 1875 | 38.5 |
| 1885 | 39.5 |
| 1895 | 42.8 |
| 1905 | 45.5 |
| 1911 | 49.0 |
| 1915 | 40.5 |
| 1925 | 57.4 |
| 1935 | 61.5 |
| 1946 [ 37 ] | 60.5 |
| فترة | متوسط العمر المتوقع |
|---|---|
| 1950–1955 | 67.5 |
| 1955–1960 | 68.9 |
| 1960–1965 | 70.0 |
| 1965–1970 | 70.7 |
| 1970–1975 | 71.2 |
| 1975–1980 | 72.3 |
| 2010–2015 | 80.4 |
| 1980–1985 | 73.7 |
| 1985–1990 | 75.0 |
| 1990–1995 | 76.0 |
| 2000–2005 | 78.6 |
| 2005–2010 | 79.7 |
| 2010–2015 | 80.4 |
| 2015–2020 | 81.1 |
| 2015–2020 | 81.1 |
المصدر: توقعات الأمم المتحدة للسكان في العالم [ 38 ]
متوسط العمر المتوقع عند الولادة
- إجمالي عدد السكان
- 80.8 سنة
- ذكر
- 78.5 سنة
- أنثى
- 83.3 سنة (تقديرات عام 2017)
- مقارنة الدول بالدول الأخرى حول العالم
- الرابع والثلاثون
التركيب العمري
- من 0 إلى 14 سنة
- 12.83% (ذكور 5,299,798 / إناث 5,024,184)
- 15-24 سنة
- 9.98% (ذكور 4,092,901 / إناث 3,933,997)
- 25-54 سنة
- 39.87% (ذكور 16,181,931 / إناث 15,896,528)
- 55-64 سنة
- 14.96% (ذكور 5,989,111 / إناث 6,047,449)
- 65 عامًا فأكثر
- 22.36% (الذكور 7,930,590 / الإناث 10,061,248) (تقديرات 2018)
متوسط العمر :
- المجموع
- 47.4 سنة
- ذكر
- 46.2 سنة
- أنثى
- 48.5 سنة (تقديرات عام 2018)
- مقارنة الدول بالدول الأخرى حول العالم
- الثالث
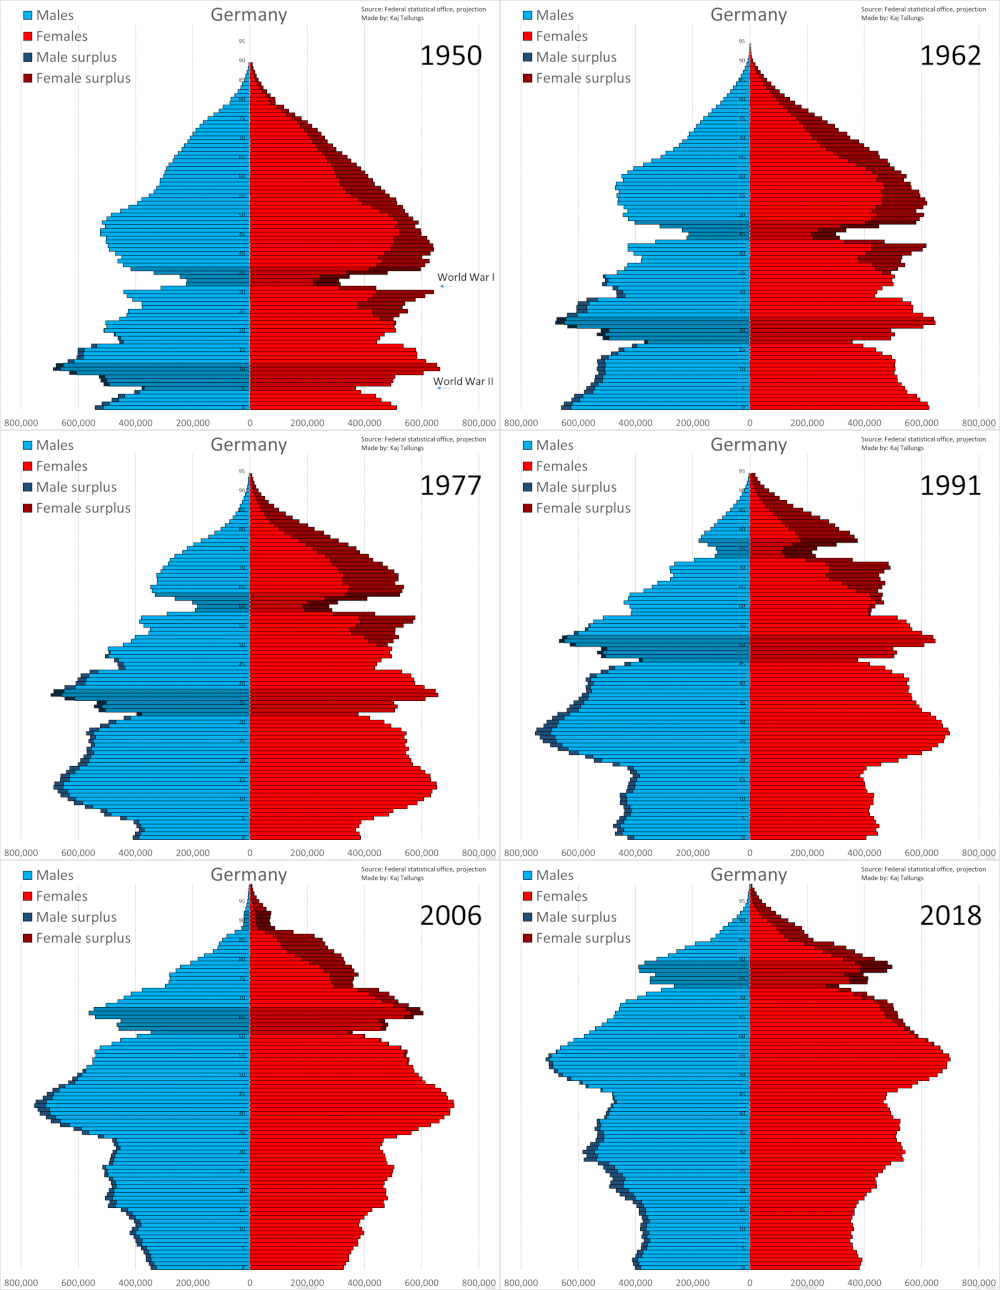
 الهرم السكاني في عام 1933
 الهرم السكاني في عام 1946
 الهرم السكاني في عام 1950
 الهرم السكاني في عام 2000

الإحصاءات الحيوية
إحصائيات منذ عام 1817
إحصاءات السكان منذ عام 1817. [ 39 ] [ 40 ] حدثت تغييرات إقليمية في ألمانيا في عام 1866 (تأسيس الاتحاد الألماني الشمالي )، وعام 1871 (توحيد ألمانيا وضم الألزاس واللورين)، وعام 1918/1919، وعام 1921/1922، وعام 1945/1946، وفي عام 1990. قد تحتوي بيانات الوفيات على بعض الأخطاء الطفيفة لكلا الحربين العالميتين.
أحداث بارزة في التركيبة السكانية الألمانية:
- 1831، 1848-1855، 1866، 1892-1893 - تفشي الكوليرا
- 1848 – ثورات عام 1848
- 1871 – الجدري
- 1870-1871 – الحرب الفرنسية البروسية
- 1899-1900 - الإنفلونزا الروسية
- 1914–1918 – الحرب العالمية الأولى
- 1918-1919 - الإنفلونزا الإسبانية
- 1939–1945 – الحرب العالمية الثانية
- 1944-1949 - فرار وطرد الألمان
- 1955-1973 – برنامج Gastarbeiter
- 1989 – ثورات عام 1989
- 2015 – أزمة المهاجرين الأوروبية
- 2022 – الغزو الروسي لأوكرانيا
| سنة | متوسط عدد السكان | المواليد الأحياء | حالات الوفاة | التغير الطبيعي | معدل المواليد الخام (لكل 1000) | معدل الوفيات الخام (لكل 1000) | التغير الطبيعي (لكل 1000) | التغير الخام في الهجرة (لكل 1000 نسمة) | معدلات الخصوبة الكلية [ fn 1 ] [ 34 ] [ 41 ] [ 42 ] [ 43 ] [ 44 ] [ 45 ] [ 46 ] | ||
|---|---|---|---|---|---|---|---|---|---|---|---|
| كل ألمانيا | ألمانيا الفرنسية | جمهورية ألمانيا الديمقراطية (السابقة) | |||||||||
| 1817 | 25,009,000 | 987,856 | 675,243 | 312,613 | 39.5 | 27.0 | 12.5 | 5.32 | |||
| 1818 | 25,369,000 | 1,002,076 | 687,500 | 314,576 | 39.5 | 27.1 | 12.4 | 2.0 | 5.33 | ||
| 1819 | 25,733,000 | 1,067,920 | 717,951 | 349,969 | 41.5 | 27.9 | 13.6 | 0.7 | 5.35 | ||
| 1820 | 26,101,000 | 1,041,430 | 636,864 | 404,566 | 39.9 | 24.4 | 15.5 | -1.2 | 5.37 | ||
| 1821 | 26,473,000 | 1,080,098 | 606,232 | 473,867 | 40.8 | 22.9 | 17.9 | -3.6 | 5.35 | ||
| 1822 | 26,851,000 | 1,065,985 | 660,535 | 405,450 | 39.7 | 24.6 | 15.1 | -0.8 | 5.33 | ||
| 1823 | 27,217,000 | 1,056,020 | 666,817 | 389,203 | 38.8 | 24.5 | 14.3 | -0.7 | 5.31 | ||
| 1824 | 27,571,000 | 1,064,241 | 667,218 | 397,022 | 38.6 | 24.2 | 14.4 | -1.4 | 5.28 | ||
| 1825 | 27,930,000 | 1,092,063 | 684,285 | 407,778 | 39.1 | 24.5 | 14.6 | -1.6 | 5.26 | ||
| 1826 | 28,259,000 | 1,099,275 | 737,560 | 361,715 | 38.9 | 26.1 | 12.8 | -1.0 | 5.17 | ||
| 1827 | 28,558,000 | 1,030,944 | 753,931 | 277,013 | 36.1 | 26.4 | 9.7 | 0.9 | 5.07 | ||
| 1828 | 28,863,000 | 1,041,954 | 767,756 | 274,199 | 36.1 | 26.6 | 9.5 | 1.2 | 4.97 | ||
| 1829 | 29,143,000 | 1,028,748 | 810,175 | 218,573 | 35.3 | 27.8 | 7.5 | 2.2 | 4.88 | ||
| 1830 | 29,392,000 | 1,043,416 | 805,341 | 238,075 | 35.5 | 27.4 | 8.1 | 0.4 | 4.78 | ||
| 1831 | 29,642,000 | 1,037,047 | 901,117 | 136,353 | 35.0 | 30.4 | 4.6 | 3.9 | 4.80 | ||
| 1832 | 29,906,000 | 1,019,795 | 864,283 | 155,511 | 34.1 | 28.9 | 5.2 | 3.7 | 4.83 | ||
| 1833 | 30,185,000 | 1,107,790 | 860,273 | 247,517 | 36.7 | 28.2 | 8.2 | 1.1 | 4.85 | ||
| 1834 | 30,467,000 | 1,145,559 | 895,730 | 249,829 | 37.6 | 29.4 | 8.2 | 1.1 | 4.88 | ||
| 1835 | 30,802,000 | 1,121,193 | 807,012 | 314,180 | 36.4 | 26.2 | 10.2 | 0.8 | 4.90 | ||
| 1836 | 31,129,000 | 1,142,434 | 806,241 | 336193 | 36.7 | 25.9 | 10.8 | -0.2 | 4.90 | ||
| 1837 | 31,455,000 | 1,141,817 | 915,341 | 226,476 | 36.3 | 29.1 | 7.2 | 3.3 | 4.90 | ||
| 1838 | 31,824,000 | 1,155,211 | 827,424 | 327,787 | 36.3 | 26.0 | 10.3 | 1.4 | 4.90 | ||
| 1839 | 32,223,000 | 1,172,917 | 876,466 | 296,452 | 36.4 | 27.2 | 9.2 | 3.3 | 4.90 | ||
| 1840 | 32,621,000 | 1,187,404 | 864,457 | 322,948 | 36.4 | 26.5 | 9.9 | 2.5 | 4.90 | ||
| 1841 | 32,979,000 | 1,201,587 | 864,075 | 337,512 | 36.4 | 26.2 | 10.2 | 0.8 | 4.92 | ||
| 1842 | 33,298,000 | 1,251,102 | 902,529 | 348,573 | 37.6 | 27.1 | 10.5 | -0.8 | 4.95 | ||
| 1843 | 33,605,000 | 1,209,762 | 905,608 | 304,154 | 36.0 | 26.9 | 9.1 | 0.1 | 4.97 | ||
| 1844 | 33,922,000 | 1,216,429 | 830,345 | 386,084 | 35.9 | 24.5 | 11.4 | -2.0 | 5.00 | ||
| 1845 | 34,284,000 | 1,278,286 | 867,729 | 410,557 | 37.3 | 25.3 | 12.0 | -1.3 | 5.02 | ||
| 1846 | 34,610,000 | 1,244,369 | 939,436 | 304,933 | 36.0 | 27.1 | 8.8 | 0.7 | 5.02 | ||
| 1847 | 34,784,000 | 1,156,820 | 983,981 | 172,839 | 33.3 | 28.3 | 5.0 | 0 | 5.02 | ||
| 1848 | 34,839,000 | 1,160,533 | 1,011,954 | 148,579 | 33.3 | 29.0 | 4.3 | -2.7 | 5.01 | ||
| 1849 | 35,004,000 | 1,333,379 | 947,476 | 385,903 | 38.1 | 27.1 | 11.0 | -6.3 | 5.01 | ||
| 1850 | 35,303,000 | 1,311,726 | 903,521 | 408,203 | 37.2 | 25.6 | 11.6 | -3.1 | 5.01 | ||
| 1851 | 35,620,000 | 1,306,877 | 889,601 | 417,276 | 36.7 | 25.0 | 11.7 | -2.7 | 4.87 | ||
| 1852 | 35,858,000 | 1,271,446 | 1,018,135 | 253,311 | 35.5 | 28.4 | 7.1 | -0.4 | 4.74 | ||
| 1853 | 35,989,000 | 1,244,192 | 978,650 | 265,542 | 34.6 | 27.2 | 7.4 | -3.7 | 4.60 | ||
| 1854 | 35,923,000 | 1,226,769 | 972,726 | 254,043 | 34.0 | 27.0 | 6.9 | -8.7 | 4.47 | ||
| 1855 | 36,136,000 | 1,162,945 | 1,016,284 | 146,661 | 32.2 | 28.1 | 4.1 | 1.8 | 4.33 | ||
| 1856 | 36,257,000 | 1,215,390 | 913,913 | 301,477 | 33.5 | 25.2 | 8.3 | -5.0 | 4.45 | ||
| 1857 | 36,524,000 | 1,315,034 | 991,753 | 323,281 | 36.0 | 27.2 | 8.9 | -1.5 | 4.56 | ||
| 1858 | 36,828,000 | 1,354,817 | 985,176 | 368,641 | 36.8 | 26.8 | 10.0 | -1.7 | 4.67 | ||
| 1859 | 37,188,000 | 1,393,339 | 956,924 | 436,415 | 37.5 | 25.7 | 11.7 | -1.9 | 4.79 | ||
| 1860 | 37,609,000 | 1,367,012 | 873,364 | 493,648 | 36.3 | 23.2 | 13.1 | -1.8 | 4.90 | ||
| 1861 | 38,001,000 | 1,357,355 | 972,989 | 384,366 | 35.7 | 25.6 | 10.1 | 0.3 | 4.93 | ||
| 1862 | 38,360,000 | 1,358,896 | 945,530 | 413,366 | 35.4 | 24.6 | 10.8 | -1.4 | 4.96 | ||
| 1863 | 38,763,000 | 1,454,340 | 996,193 | 458,147 | 37.5 | 25.7 | 11.8 | -1.3 | 5.00 | ||
| 1864 | 39,187,000 | 1,481,778 | 1,027,756 | 454,022 | 37.8 | 26.2 | 11.6 | -0.7 | 5.03 | ||
| 1865 | 39,545,000 | 1,488,620 | 1,091,419 | 397,201 | 37.6 | 27.6 | 10.0 | -0.9 | 5.06 | ||
| 1866 | 39,765,000 | 1,505,287 | 1,217,591 | 287,696 | 37.8 | 30.6 | 7.2 | -1.6 | 5.09 | ||
| 1867 | 40,031,000 | 1,471,747 | 1,045,534 | 426,213 | 36.8 | 26.1 | 10.6 | -3.9 | 5.11 | ||
| 1868 | 40,223,000 | 1,481,727 | 1,110,620 | 371,107 | 36.8 | 27.6 | 9.2 | -4.4 | 5.13 | ||
| 1869 | 40,493,000 | 1,529,387 | 1,089,503 | 439,884 | 37.8 | 26.9 | 10.9 | -4.2 | 5.16 | ||
| 1870 | 40,804,000 | 1,569,206 | 1,117,875 | 451,331 | 38.5 | 27.4 | 11.1 | -3.4 | 5.18 | ||
| 1871 | 40,997,000 | 1,414,248 | 1,212,869 | 201,379 | 34.5 | 29.6 | 4.9 | -0.2 | 4.47 | ||
| 1872 | 41,230,000 | 1,626,037 | 1,194,732 | 431,305 | 39.5 | 29.0 | 10.5 | -4.8 | 5.11 | ||
| 1873 | 41,564,000 | 1,648,117 | 1,174,293 | 473,824 | 39.7 | 28.3 | 11.4 | -3.3 | 5.17 | ||
| 1874 | 42,004,000 | 1,683,440 | 1,122,396 | 561,044 | 40.1 | 26.7 | 13.4 | -2.8 | 5.24 | ||
| 1875 | 42,518,000 | 1,724,412 | 1,172,393 | 552,019 | 40.6 | 27.6 | 13.0 | -0.8 | 5.34 | ||
| 1876 | 43,059,000 | 1,761,046 | 1,134,452 | 626,594 | 40.9 | 26.3 | 14.6 | -1.9 | 5.42 | ||
| 1877 | 43,610,000 | 1,744,659 | 1,152,023 | 592,636 | 40.0 | 26.4 | 13.6 | -0.8 | 5.34 | ||
| 1878 | 44,135,000 | 1,716,852 | 1,156,337 | 560,515 | 35.5 | 28.4 | 12.7 | -0.7 | 5.20 | ||
| 1879 | 44,655,000 | 1,737,080 | 1,143,168 | 593,912 | 38.9 | 26.2 | 12.5 | -0.7 | 5.22 | ||
| 1880 | 45,095,000 | 1,696,175 | 1,173,205 | 522,970 | 37.6 | 26.0 | 11.6 | -1.7 | 5.05 | ||
| 1881 | 45,426,000 | 1,682,649 | 1,156,391 | 525,758 | 37.0 | 25.5 | 11.5 | -4.2 | 4.98 | ||
| 1882 | 45,717,000 | 1,702,348 | 1,176,853 | 525,495 | 37.2 | 25.7 | 11.5 | -5.1 | 5.01 | ||
| 1883 | 46,014,000 | 1,683,699 | 1,190,002 | 493,697 | 36.6 | 25.9 | 10.7 | -4.2 | 4.92 | ||
| 1884 | 46,335,000 | 1,725,583 | 1,203,500 | 522,083 | 37.2 | 26.0 | 11.3 | -4.3 | 5.02 | ||
| 1885 | 46,705,000 | 1,729,927 | 1,199,742 | 530,185 | 37.0 | 25.7 | 11.4 | -3.4 | 4.99 | ||
| 1886 | 47,103,000 | 1,746,133 | 1,233,737 | 512,396 | 37.1 | 26.2 | 10.9 | -2.4 | 4.99 | ||
| 1887 | 47,540,000 | 1,757,079 | 1,151,924 | 605,155 | 36.9 | 24.2 | 12.7 | -3.4 | 4.96 | ||
| 1888 | 48,020,000 | 1,761,407 | 1,142,826 | 618,581 | 36.6 | 23.7 | 12.9 | -2.8 | 4.92 | ||
| 1889 | 48,512,000 | 1,772,570 | 1,153,087 | 619,483 | 36.4 | 23.7 | 12.8 | -2.6 | 4.88 | ||
| 1890 | 49,239,000 | 1,759,253 | 1,199,006 | 560,247 | 35.7 | 24.4 | 11.4 | 3.6 | 4.78 | ||
| 1891 | 49,767,000 | 1,840,172 | 1,164,421 | 675,751 | 37.0 | 23.4 | 13.6 | -2.9 | 4.92 | ||
| 1892 | 50,279,000 | 1,795,971 | 1,211,402 | 584,569 | 35.7 | 24.1 | 11.6 | -1.3 | 4.73 | ||
| 1893 | 50,778,000 | 1,865,715 | 1,248,201 | 617,514 | 36.8 | 24.6 | 12.2 | -2.3 | 4.83 | ||
| 1894 | 51,339,000 | 1,841,205 | 1,144,331 | 696,874 | 35.9 | 22.3 | 13.6 | -2.6 | 4.70 | ||
| 1895 | 52,001,000 | 1,877,278 | 1,151,488 | 725,790 | 36.1 | 22.1 | 14.0 | -1.1 | 4.71 | ||
| 1896 | 52,753,000 | 1,914,749 | 1,098,966 | 815,783 | 36.3 | 20.8 | 15.5 | -1.0 | 4.72 | ||
| 1897 | 53,549,000 | 1,926,690 | 1,142,056 | 784,634 | 36.1 | 21.3 | 14.7 | 0.4 | 4.67 | ||
| 1898 | 54,406,000 | 1,964,731 | 1,117,860 | 846,871 | 36.1 | 20.5 | 15.6 | 0.4 | 4.69 | ||
| 1899 | 55,248,000 | 1,980,304 | 1,185,197 | 795,107 | 35.9 | 21.5 | 14.4 | 1.1 | 4.66 | ||
| 1900 | 56,046,000 | 1,996,139 | 1,236,382 | 759,757 | 35.6 | 22.1 | 13.6 | 0.8 | 4.63 | ||
| 1901 | 56,874,000 | 2,032,313 | 1,174,489 | 857,824 | 35.7 | 20.7 | 15.0 | -0.2 | 4.65 | ||
| 1902 | 57,767,000 | 2,024,735 | 1,122,492 | 902,243 | 35.1 | 19.4 | 15.7 | 0 | 4.56 | ||
| 1903 | 58,629,000 | 1,983,078 | 1,170,905 | 812,173 | 33.8 | 20.0 | 13.8 | 1.1 | 4.40 | ||
| 1904 | 59,475,000 | 2,025,847 | 1,163,183 | 862,664 | 34.0 | 19.6 | 14.5 | -0.1 | 4.42 | ||
| 1905 | 60,314,000 | 1,987,153 | 1,194,314 | 792,839 | 33.0 | 19.8 | 13.1 | 1.0 | 4.27 | ||
| 1906 | 61,153,000 | 2,022,477 | 1,112,202 | 910,275 | 33.1 | 18.2 | 14.9 | -1.0 | 4.28 | ||
| 1907 | 62,013,000 | 1,999,933 | 1,117,309 | 882,624 | 32.3 | 18.0 | 14.2 | -0.1 | 4.18 | ||
| 1908 | 62,863,000 | 2,015,052 | 1,135,490 | 879,562 | 32.1 | 18.1 | 14.0 | -0.3 | 4.15 | ||
| 1909 | 63,857,000 | 1,978,278 | 1,094,217 | 884,061 | 31.0 | 17.2 | 13.9 | 1.9 | 4.01 | ||
| 1910 | 64,568,000 | 1,924,778 | 1,045,665 | 879,113 | 29.8 | 16.2 | 13.6 | -2.5 | 3.85 | ||
| 1911 | 65,359,000 | 1,870,729 | 1,130,784 | 739,945 | 28.6 | 17.3 | 11.3 | 1.0 | 3.69 | ||
| 1912 | 66,146,000 | 1,869,636 | 1,029,749 | 839,887 | 28.3 | 15.6 | 12.7 | -0.7 | 3.64 | ||
| 1913 | 66,978,000 | 1,838,750 | 1,004,950 | 833,800 | 27.5 | 15.0 | 12.4 | 0.2 | 3.53 | ||
| 1914 | 67,790,000 | 1,818,596 | 1,291,310 | 527,286 | 26.8 | 19.0 | 7.8 | 4.3 | 3.44 | ||
| 1915 | 67,883,000 | 1,382,546 | 1,450,420 | -67,874 | 20.4 | 21.4 | -1.0 | 2.4 | 2.58 | ||
| 1916 | 67,715,000 | 1,029,484 | 1,298,054 | -268,570 | 15.2 | 19.2 | -4.1 | 1.6 | 1.90 | ||
| 1917 | 67,368,000 | 912,109 | 1,345,424 | -433,315 | 13.9 | 20.6 | -6.4 | 1.3 | 1.66 | ||
| 1918 | 66,811,000 | 926,813 | 1,606,475 | -679,662 | 14.3 | 24.8 | -10.2 | 1.9 | 1.67 | ||
| 1919 | 62,897,000 | 1,260,500 | 978,380 | 282,120 | 20.0 | 15.6 | 4.5 | 63.1 | 2.37 | ||
| 1920 | 61,794,000 | 1,599,287 | 932,929 | 666,358 | 25.9 | 15.1 | 10.8 | -28.3 | 3.06 | ||
| 1921 | 62,473,000 | 1,581,130 | 869,555 | 711,575 | 25.3 | 13.9 | 11.4 | -0.4 | 2.98 | ||
| 1922 | 61,890,000 | 1,424,804 | 890,181 | 534,623 | 23.0 | 14.4 | 8.6 | -17.9 | 2.69 | ||
| 1923 | 62,250,000 | 1,318,489 | 866,754 | 451,735 | 21.2 | 13.9 | 7.2 | -1.4 | 2.45 | ||
| 1924 | 62,740,000 | 1,290,763 | 766,957 | 523,806 | 20.6 | 12.2 | 8.3 | -0.4 | 2.37 | ||
| 1925 | 63,110,000 | 1,311,259 | 753,017 | 558,242 | 20.8 | 11.9 | 8.8 | -2.9 | 2.38 | ||
| 1926 | 63,510,000 | 1,245,471 | 742,955 | 502,516 | 19.6 | 11.7 | 7.9 | -1.6 | 2.23 | ||
| 1927 | 63,940,000 | 1,178,892 | 765,331 | 413,561 | 18.4 | 12.0 | 6.5 | 0.3 | 2.09 | ||
| 1928 | 64,470,000 | 1,199,998 | 747,444 | 452,554 | 18.6 | 11.6 | 7.0 | 1.3 | 2.11 | ||
| 1929 | 64,670,000 | 1,164,062 | 814,545 | 349,517 | 18.0 | 12.6 | 5.4 | -2.3 | 2.02 | ||
| 1930 | 65,130,000 | 1,144,151 | 718,807 | 425,344 | 17.6 | 11.0 | 6.5 | 0.6 | 1.98 | ||
| 1931 | 65,510,000 | 1,047,775 | 734,165 | 313,610 | 16.0 | 11.2 | 4.8 | 1.0 | 1.80 | ||
| 1932 | 65,716,000 | 993,126 | 707,642 | 285,484 | 15.1 | 10.8 | 4.3 | -1.2 | 1.70 | ||
| 1933 | 66,027,000 | 971,174 | 737,877 | 233,297 | 14.7 | 11.2 | 3.5 | 1.2 | 1.67 | ||
| 1934 | 66,409,000 | 1,198,350 | 725,000 | 473,000 | 18.0 | 10.9 | 7.1 | -1.3 | 2.07 | ||
| 1935 | 66,871,000 | 1,263,976 | 792,018 | 471,958 | 18.9 | 11.8 | 7.1 | -0.1 | 2.20 | ||
| 1936 | 67,349,000 | 1,278,583 | 795,793 | 482,790 | 19.0 | 11.8 | 7.2 | -0.1 | 2.25 | ||
| 1937 | 67,831,000 | 1,277,046 | 794,367 | 482,679 | 18.8 | 11.7 | 7.1 | 0.1 | 2.28 | ||
| 1938 | 68,424,000 | 1,348,534 | 799,220 | 549,314 | 19.7 | 11.7 | 8.0 | 0.7 | 2.45 | ||
| 1939 | 69,314,000 | 1,413,230 | 873,348 | 539,882 | 20.4 | 12.6 | 7.8 | 5.2 | 2.59 | ||
| 1940 | 69,838,000 | 1,402,258 | 968,591 | 433,667 | 20.1 | 13.9 | 6.2 | 1.3 | 2.59 | ||
| 1941 | 70,244,000 | 1,308,232 | 1,201,435 | 106,797 | 18.6 | 17.1 | 1.5 | 4.3 | 2.43 | ||
| 1942 | 70,834,000 | 1,055,915 | 1,419,861 | -363,946 | 14.9 | 20.0 | -5.1 | 13.5 | 1.97 | ||
| 1943 | 70,411,000 | 1,124,718 | 1,665,246 | -540,528 | 16.0 | 23.7 | -7.7 | 1.7 | 2.10 | ||
| 1944 | 69,000,000 | 1,090,000(هـ) | 2,717,000 | -1,627,000 | 15.8 | 39.4 | -23.6 | 3.6 | 2.05 | ||
| 1945 | 66,000,000 | 820,000(هـ) | 2,750,000 | -1,930,000 | 12.4 | 41.7 | -29.2 | -14.3 | 1.56 | ||
| 1946 | 64,260,000 | 921,998 | 1,077,331 | -155,333 | 14.3 | 16.8 | -2.4 | -21.9 | 1.80 | 1.91 | 1.47 |
| 1947 | 65,842,000 | 1,028,421 | 965,628 | 62,793 | 15.6 | 14.7 | 1.0 | 23.7 | 1.99 | 2.02 | 1.92 |
| 1948 | 67,365,000 | 1,049,074 | 817,839 | 231,235 | 15.6 | 12.1 | 3.4 | 19.7 | 2.03 | 2.08 | 1.89 |
| 1949 | 68,080,000 | 1,106,803 | 779,852 | 326,951 | 16.3 | 11.5 | 4.8 | 5.8 | 2.14 | 2.15 | 2.13 |
| 1950 | 68,374,000 | 1,116,701 | 754,329 | 362,372 | 16.3 | 11.0 | 5.3 | -1.0 | 2.17 | 2.10 | 2.37 |
| 1951 | 68,882,000 | 1,106,380 | 755,697 | 350,683 | 16.1 | 11.0 | 5.1 | 2.3 | 2.16 | 2.07 | 2.43 |
| 1952 | 69,171,000 | 1,105,084 | 769,639 | 335,445 | 16.0 | 11.1 | 4.9 | -0.7 | 2.16 | 2.08 | 2.40 |
| 1953 | 69,564,000 | 1,095,029 | 791,654 | 303,375 | 15.7 | 11.4 | 4.4 | 1.3 | 2.13 | 2.05 | 2.37 |
| 1954 | 69,934,000 | 1,109,743 | 776,291 | 333,452 | 15.9 | 11.1 | 4.8 | 0.5 | 2.16 | 2.10 | 2.35 |
| 1955 | 70,307,000 | 1,113,408 | 795,938 | 317,470 | 15.8 | 11.3 | 4.5 | 0.8 | 2.17 | 2.11 | 2.35 |
| 1956 | 70,711,000 | 1,137,169 | 812,111 | 325,058 | 16.1 | 11.5 | 4.6 | 1.1 | 2.22 | 2.20 | 2.26 |
| 1957 | 71,166,000 | 1,165,555 | 840,195 | 325,360 | 16.4 | 11.8 | 4.6 | 1.8 | 2.28 | 2.30 | 2.21 |
| 1958 | 71,637,000 | 1,175,870 | 818,418 | 357,452 | 16.4 | 11.4 | 5.0 | 1.6 | 2.29 | 2.29 | 2.22 |
| 1959 | 72,180,000 | 1,243,922 | 835,402 | 408,520 | 17.2 | 11.6 | 5.7 | 1.9 | 2.36 | 2.37 | 2.35 |
| 1960 | 72,664,000 | 1,261,614 | 876,721 | 384,893 | 17.4 | 12.1 | 5.3 | 1.4 | 2.36 | 2.37 | 2.33 |
| 1961 | 73,352,000 | 1,313,505 | 850,300 | 463,205 | 17.9 | 11.6 | 6.3 | 3.2 | 2.44 | 2.46 | 2.40 |
| 1962 | 74,049,000 | 1,316,534 | 878,814 | 437,720 | 17.8 | 11.9 | 5.9 | 3.6 | 2.44 | 2.44 | 2.42 |
| 1963 | 75,019,000 | 1,355,595 | 895,070 | 460,525 | 18.1 | 11.9 | 6.1 | 7.0 | 2.51 | 2.52 | 2.47 |
| 1964 | 75,273,000 | 1,357,304 | 870,319 | 486,985 | 18.0 | 11.6 | 6.5 | -3.1 | 2.54 | 2.54 | 2.48 |
| 1965 | 76,061,000 | 1,325,386 | 907,882 | 417,504 | 17.4 | 11.9 | 5.5 | 5.0 | 2.50 | 2.51 | 2.48 |
| 1966 | 76,734,000 | 1,318,303 | 911,984 | 406,319 | 17.2 | 11.9 | 5.3 | 3.5 | 2.51 | 2.54 | 2.42 |
| 1967 | 76,954,000 | 1,272,276 | 914,417 | 357,859 | 16.5 | 11.9 | 4.7 | -1.8 | 2.46 | 2.49 | 2.34 |
| 1968 | 77,249,000 | 1,214,968 | 976,521 | 238,447 | 15.7 | 12.6 | 3.1 | 0.7 | 2.36 | 2.38 | 2.30 |
| 1969 | 77,918,000 | 1,142,366 | 988,092 | 154,274 | 14.7 | 12.7 | 2.0 | 6.7 | 2.22 | 2.21 | 2.24 |
| 1970 | 78,205,000 | 1,047,737 | 975,664 | 72,073 | 13.5 | 12.5 | 0.9 | -2.8 | 2.05 | 2.02 | 2.19 |
| 1971 | 78,355,000 | 1,013,396 | 965,623 | 47,773 | 12.9 | 12.3 | 0.6 | 6.9 | 1.97 | 1.92 | 2.13 |
| 1972 | 78,717,000 | 901,657 | 965,689 | -64,032 | 11.5 | 12.3 | -0.8 | 5.4 | 1.73 | 1.71 | 1.79 |
| 1973 | 78,951,000 | 815,969 | 962,988 | -147,019 | 10.3 | 12.2 | -1.9 | 4.9 | 1.56 | 1.54 | 1.58 |
| 1974 | 78,966,000 | 805,500 | 956,573 | -151,073 | 10.2 | 12.1 | -1.9 | 2.1 | 1.53 | 1.51 | 1.54 |
| 1975 | 78,862,000 | 782,310 | 989,649 | -207,339 | 9.9 | 12.5 | -2.6 | 1.3 | 1.48 | 1.45 | 1.54 |
| 1976 | 78,299,000 | 798,334 | 966,873 | -168,539 | 10.2 | 12.3 | -2.2 | -4.9 | 1.50 | 1.46 | 1.64 |
| 1977 | 78,161,000 | 805,496 | 931,155 | -125,659 | 10.3 | 11.9 | -1.6 | -0.2 | 1.51 | 1.41 | 1.85 |
| 1978 | 78,066,000 | 808,619 | 955,550 | -146,931 | 10.4 | 12.2 | -1.9 | 0.7 | 1.50 | 1.38 | 1.90 |
| 1979 | 78,082,000 | 817,217 | 944,474 | -127,257 | 10.5 | 12.1 | -1.6 | 1.8 | 1.50 | 1.38 | 1.90 |
| 1980 | 78,295,000 | 865,789 | 952,371 | -86,582 | 11.1 | 12.2 | -1.1 | 3.8 | 1.56 | 1.45 | 1.94 |
| 1981 | 78,399,000 | 862,100 | 954,436 | -92,336 | 11.0 | 12.2 | -1.2 | 2.5 | 1.53 | 1.44 | 1.85 |
| 1982 | 78,293,000 | 861,275 | 943,832 | -82,557 | 11.0 | 12.1 | -1.1 | -0.3 | 1.51 | 1.41 | 1.86 |
| 1983 | 78,082,000 | 827,933 | 941,032 | -113,099 | 10.6 | 12.1 | -1.4 | -1.3 | 1.43 | 1.33 | 1.79 |
| 1984 | 77,797,000 | 812,292 | 917,299 | -105,007 | 10.4 | 11.8 | -1.3 | -2.4 | 1.38 | 1.29 | 1.74 |
| 1985 | 77,619,000 | 813,803 | 929,649 | -115,846 | 10.5 | 12.0 | -1.5 | -0.8 | 1.37 | 1.28 | 1.73 |
| 1986 | 77,635,000 | 848,232 | 925,426 | -77,194 | 10.9 | 11.9 | -1.0 | 1.2 | 1.41 | 1.35 | 1.70 |
| 1987 | 77,718,000 | 867,969 | 901,291 | -33,322 | 11.2 | 11.6 | -0.4 | 1.5 | 1.44 | 1.37 | 1.74 |
| 1988 | 78,116,000 | 892,993 | 900,627 | -7,634 | 11.4 | 11.5 | -0.1 | 5.2 | 1.46 | 1.41 | 1.67 |
| 1989 | 78,677,000 | 880,459 | 903,441 | -22,982 | 11.2 | 11.5 | -0.3 | 7.5 | 1.42 | 1.40 | 1.57 |
| 1990 | 79,753,227 | 905,675 | 921,445 | -15,770 | 11.4 | 11.6 | -0.2 | 13.7 | 1.45 | 1.45 | 1.52 |
| 1991 | 80,193,591 | 830,019 | 911,245 | -81,226 | 10.4 | 11.4 | -1.0 | 6.5 | 1.33 | 1.42 | 0.98 |
| 1992 | 80,806,040 | 809,114 | 885,443 | -76,329 | 10.0 | 11.0 | -1.0 | 8.5 | 1.29 | 1.40 | 0.83 |
| 1993 | 81,086,917 | 798,447 | 897,270 | -98,823 | 9.8 | 11.1 | -1.3 | 4.7 | 1.28 | 1.39 | 0.78 |
| 1994 | 81,208,056 | 769,603 | 884,661 | -115,058 | 9.5 | 10.9 | -1.4 | 2.9 | 1.24 | 1.35 | 0.77 |
| 1995 | 81,407,374 | 765,221 | 884,588 | -119,367 | 9.4 | 10.9 | -1.5 | 3.9 | 1.25 | 1.34 | 0.84 |
| 1996 | 81,525,442 | 796,013 | 882,843 | -86,830 | 9.8 | 10.8 | -1.0 | 2.5 | 1.32 | 1.40 | 0.95 |
| 1997 | 81,494,362 | 812,173 | 860,389 | -48,216 | 10.0 | 10.6 | -0.6 | 0.2 | 1.37 | 1.44 | 1.04 |
| 1998 | 81,397,553 | 785,034 | 852,382 | -67,348 | 9.6 | 10.5 | -0.9 | -0.4 | 1.36 | 1.41 | 1.09 |
| 1999 | 81,447,257 | 770,744 | 846,330 | -75,586 | 9.5 | 10.4 | -0.9 | 1.5 | 1.36 | 1.41 | 1.15 |
| 2000 | 81,465,977 | 766,999 | 838,797 | -71,798 | 9.4 | 10.3 | -0.9 | 1.1 | 1.38 | 1.41 | 1.21 |
| 2001 | 81,568,568 | 734,475 | 828,541 | -94,066 | 9.0 | 10.2 | -1.2 | 2.4 | 1.35 | 1.38 | 1.23 |
| 2002 | 81,588,182 | 719,250 | 841,686 | -122,436 | 8.8 | 10.3 | -1.5 | 1.7 | 1.34 | 1.37 | 1.24 |
| 2003 | 81,509,236 | 706,721 | 853,946 | -147,225 | 8.7 | 10.5 | -1.8 | 0.8 | 1.34 | 1.36 | 1.26 |
| 2004 | 81,403,684 | 705,622 | 818,271 | -112,649 | 8.7 | 10.1 | -1.4 | 0.1 | 1.36 | 1.37 | 1.31 |
| 2005 | 81,269,642 | 685,795 | 830,227 | -144,432 | 8.4 | 10.2 | -1.8 | 0.1 | 1.34 | 1.36 | 1.30 |
| 2006 | 81,076,636 | 672,724 | 821,627 | -148,903 | 8.3 | 10.1 | -1.8 | -0.5 | 1.33 | 1.34 | 1.30 |
| 2007 | 80,907,974 | 684,862 | 827,155 | -142,293 | 8.5 | 10.4 | -1.9 | –0.1 | 1.37 | 1.38 | 1.37 |
| 2008 | 80,619,037 | 682,514 | 844,439 | -161,925 | 8.5 | 10.6 | -2.1 | -1.5 | 1.38 | 1.37 | 1.40 |
| 2009 | 80,346,078 | 665,126 | 854,544 | -189,418 | 8.3 | 10.7 | -2.4 | -1.0 | 1.36 | 1.35 | 1.40 |
| 2010 | 80,222,065 | 677,947 | 858,768 | -180,821 | 8.5 | 10.7 | -2.2 | 0.7 | 1.39 | 1.39 | 1.46 |
| 2011 | 80,327,900 | 662,685 | 852,328 | -189,643 | 8.2 | 10.6 | -2.4 | 3.7 | 1.39 | 1.38 | 1.46 |
| 2012 | 80,442,172 | 673,544 | 869,582 | -196,038 | 8.4 | 10.8 | -2.4 | 3.9 | 1.41 | 1.40 | 1.48 |
| 2013 | 80,592,031 | 682,069 | 893,825 | -211,756 | 8.5 | 11.1 | -2.6 | 4.5 | 1.42 | 1.41 | 1.49 |
| 2014 | 80,923,752 | 714,927 | 868,356 | -153,429 | 8.8 | 10.7 | -1.9 | 6.0 | 1.47 | 1.47 | 1.54 |
| 2015 | 81,768,596 | 737,575 | 925,200 | -187,625 | 9.0 | 11.3 | -2.3 | 12.6 | 1.50 | 1.50 | 1.56 |
| 2016 | 81,964,858 | 792,141 | 910,902 | -118,761 | 9.7 | 11.1 | -1.4 | 3.8 | 1.59 | 1.60 | 1.64 |
| 2017 | 82,110,386 | 784,901 | 932,272 | -147,371 | 9.6 | 11.4 | -1.8 | 3.6 | 1.57 | 1.58 | 1.61 |
| 2018 | 82,202,695 | 787,523 | 954,874 | -167,351 | 9.6 | 11.6 | -2.0 | 3.2 | 1.57 | 1.58 | 1.60 |
| 2019 | 82,203,466 | 778,090 | 939,520 | -161,430 | 9.5 | 11.4 | -1.9 | 2.0 | 1.54 | 1.56 | 1.56 |
| 2020 | 82,049,127 | 773,144 | 985,572 | -212,428 | 9.4 | 12.0 | -2.6 | 0.7 | 1.53 | 1.55 | 1.54 |
| 2021 | 81,940,091 | 795,492 | 1,023,687 | -228,195 | 9.7 | 12.5 | -2.8 | 1.5 | 1.58 | 1.60 | 1.54 |
| 2022 | 83,118,501 | 738,819 | 1,066,341 | -327,522 | 8.9 | 12.8 | -3.9 | 18.1 | 1.49 | 1.51 | 1.46 |
| 2023 | 83,456,045 | 692,989 | 1,028,206 | -335,217 | 8.3 | 12.3 | -4.0 | 8.1 | 1.38 | 1.41 | 1.33 |
| 2024 | 83,577,140 | 677,117 | 1,007,758 | -330,641 | 8.1 | 12.1 | -4.0 | 5.4 | 1.35 | 1.38 | 1.27 |
| 2025 | 83,467,117 | 654,241 | 1,006,588 | –352,079 | 7.8 | 12.1 | -4.3 | 2.9 | 1.32 | 1.34 | 1.22 |
– (هـ) = تقدير. سيتم مراجعته.
في عام 2023، ولد 500,670 طفلاً (72.25%) لأمهات يحملن الجنسية الألمانية، بينما ولد 96,422 طفلاً (13.91%) لأمهات يحملن الجنسية الأوروبية (باستثناء تركيا) وولد 95,897 طفلاً (13.84%) لأمهات يحملن جنسيات أخرى.
مصادر البيانات من عام 2011: تعداد السكان من 2011 إلى 2021 (استنادًا إلى تعداد الاتحاد الأوروبي لعام 2011 )، [ 47 ] تعداد السكان من عام 2022 (استنادًا إلى التعداد الألماني لعام 2022)، [ 48 ] المواليد الأحياء، [ 49 ] المواليد الأحياء والوفيات والتغير الطبيعي في عدد السكان، [ 50 ] الوفيات، [ 51 ] معدلات الخصوبة الكلية، [ 52 ] الأخبار الحالية المتعلقة بالسكان . [ 53 ]
الإحصاءات الحيوية الحالية
| فترة | المواليد الأحياء * | حالات الوفاة | زيادة طبيعية |
|---|---|---|---|
| يناير - أبريل 2025 | 204,187 | 365,405 | -161,218 |
| يناير - أبريل 2026 | 204,409 | 350,852 | -146,443 |
| اختلاف |  +222 (+0.1%) +222 (+0.1%) |  -14,553 (-3.99%) -14,553 (-3.99%) | +14,775 |
| المصدر: [ 54 ] [ 55 ] [ 56 ] | |||
* – تقدير لكلا العامين، اعتبارًا من نفس التاريخ.
عرض بيانات المصدر .
معدلات الخصوبة الإجمالية حسب الولاية الفيدرالية والجنسية
| ولاية | TFR |
|---|---|
 ساكسونيا السفلى ساكسونيا السفلى | 1.38 |
 راينلاند بالاتينات راينلاند بالاتينات | 1.36 |
 بادن-فورتمبيرغ بادن-فورتمبيرغ | 1.35 |
 بافاريا بافاريا | 1.35 |
 شمال الراين وستفاليا شمال الراين وستفاليا | 1.35 |
 هيس هيس | 1.34 |
 ألمانيا ألمانيا | 1.32 |
 بريمن بريمن | 1.31 |
 براندنبورغ براندنبورغ | 1.30 |
 سارلاند سارلاند | 1.29 |
 ساكسونيا-أنهالت ساكسونيا-أنهالت | 1.27 |
 شليسفيغ هولشتاين شليسفيغ هولشتاين | 1.26 |
 مكلنبورغ-فوربومرن مكلنبورغ-فوربومرن | 1.21 |
 تورينجيا تورينجيا | 1.20 |
 هامبورغ هامبورغ | 1.24 |
 ساكسونيا ساكسونيا | 1.16 |
 برلين برلين | 1.19 |
المناطق الإدارية والمدن
| Regierungsbezirk أو المدينة | TFR |
|---|---|
| شتوتغارت | 1.44 |
| كارلسروه | 1.34 |
| فرايبورغ | 1.40 |
| توبنغن | 1.47 |
 بافاريا العليا بافاريا العليا | 1.38 |
 بافاريا السفلى بافاريا السفلى | 1.47 |
 عظم الحنك العلوي عظم الحنك العلوي | 1.46 |
 فرانكونيا العليا فرانكونيا العليا | 1.39 |
 فرانكونيا الوسطى فرانكونيا الوسطى | 1.39 |
 فرانكونيا السفلى فرانكونيا السفلى | 1.44 |
 شوابيا شوابيا | 1.54 |
 دارمشتات دارمشتات | 1.39 |
| جيسن | 1.35 |
| كاسل | 1.46 |
 براونشفايغ براونشفايغ | 1.38 |
 هانوفر هانوفر | 1.42 |
 لونيبورغ لونيبورغ | 1.53 |
| فيزر-إمس | 1.50 |
| دوسلدورف | 1.41 |
| كولونيا | 1.34 |
| مونستر | 1.50 |
| ديتمولد | 1.50 |
| أرنسبرغ | 1.45 |
 كوبلنز كوبلنز | 1.47 |
 ترير ترير | 1.38 |
| راين هيسن-بالاتينات | 1.45 |
 دريسدن دريسدن | 1.28 |
 لايبزيغ لايبزيغ | 1.14 |
| ألمانيا | 1.38 |
جنسية
| الجنسية/المنطقة | TFR |
|---|---|
| ألمانيا الإجمالي | 1.32 |
| الجنسية الألمانية | 1.20 |
| جنسية أجنبية | 1.78 |
| ألمانيا الغربية السابقة + برلين | 1.34 |
| ألمانيا الشرقية السابقة | 1.22 |
التركيبة السكانية حسب الفئات العمرية
| الفئة العمرية | ذكر | أنثى | المجموع | النسبة المئوية |
|---|---|---|---|---|
| المجموع | 39,145,941 | 41,073,754 | 80,219,695 | 100 |
| 0–4 | 1,714,872 | 1,624,023 | 3,338,895 | 4.16 |
| 5-9 | 1,809,024 | 1,716,806 | 3,525,830 | 4.40 |
| 10-14 | 2,021,305 | 1,919,261 | 3,940,566 | 4.91 |
| 15-19 | 2,057,155 | 1,956,725 | 4,013,880 | 5.00 |
| 20-24 | 2,463,932 | 2,371,707 | 4,835,639 | 6.03 |
| 25-29 | 2,455,885 | 2,416,648 | 4,872,533 | 6.07 |
| 30–34 | 2,385,305 | 2,366,606 | 4,751,911 | 5.92 |
| 35-39 | 2,378,055 | 2,364,838 | 4,742,893 | 5.91 |
| 40–44 | 3,209,481 | 3,141,708 | 6,351,189 | 7.92 |
| 45-49 | 3,547,254 | 3,452,425 | 6,999,679 | 8.73 |
| 50–54 | 3,113,463 | 3,092,831 | 6,206,294 | 7.74 |
| 55-59 | 2,668,976 | 2,750,474 | 5,419,450 | 6.76 |
| 60–64 | 2,298,903 | 2,403,912 | 4,702,815 | 5.86 |
| 65-69 | 1,999,287 | 2,174,064 | 4,173,351 | 5.20 |
| 70–74 | 2,247,196 | 2,614,043 | 4,861,239 | 6.06 |
| 75-79 | 1,413,881 | 1,856,402 | 3,270,283 | 4.08 |
| 80–84 | 878,797 | 1,449,286 | 2,328,083 | 2.90 |
| 85-89 | 369,029 | 966,047 | 1,335,076 | 1.66 |
| 90–94 | 95,074 | 335,526 | 430,600 | 0.54 |
| 95–99 | 17388 | 88,656 | 106,044 | 0.13 |
| أكثر من 100 | 1679 | 11766 | 13445 | 0.02 |
| الفئة العمرية | ذكر | أنثى | المجموع | النسبة المئوية |
| 0–14 | 5,545,201 | 5,260,090 | 10,805,291 | 13.47 |
| 15-64 | 26,578,409 | 26,317,874 | 52,896,283 | 65.94 |
| 65+ | 7,022,331 | 9,495,790 | 16,518,121 | 20.59 |
| الفئة العمرية | ذكر | أنثى | المجموع | النسبة المئوية |
|---|---|---|---|---|
| المجموع | 41,026,519 | 42,128,512 | 83,155,031 | 100 |
| 0–4 | 2,036,084 | 1,933,054 | 3,969,138 | 4.77 |
| 5-9 | 1,944,171 | 1,839,397 | 3,783,568 | 4.55 |
| 10-14 | 1,916,110 | 1,808,984 | 3,725,094 | 4.48 |
| 15-19 | 1,991,487 | 1,865,287 | 3,856,774 | 4.64 |
| 20-24 | 2,394,221 | 2,176,270 | 4,570,491 | 5.50 |
| 25-29 | 2,552,806 | 2,360,133 | 4,912,939 | 5.91 |
| 30–34 | 2,876,938 | 2,704,150 | 5,581,088 | 6.71 |
| 35-39 | 2,688,873 | 2,602,003 | 5,290,876 | 6.36 |
| 40–44 | 2,531,208 | 2,503,680 | 5,034,888 | 6.05 |
| 45-49 | 2,526,278 | 2,509,582 | 5,035,860 | 6.06 |
| 50–54 | 3,265,131 | 3,222,093 | 6,487,224 | 7.80 |
| 55-59 | 3,414,124 | 3,403,194 | 6,817,318 | 8.20 |
| 60–64 | 2,866,561 | 2,951,576 | 5,818,137 | 7.00 |
| 65-69 | 2,333,788 | 2,565,316 | 4,899,104 | 5.89 |
| 70–74 | 1,854,514 | 2,113,556 | 3,968,070 | 4.77 |
| 75-79 | 1,551,030 | 1,916,998 | 3,468,028 | 4.17 |
| 80–84 | 1,432,318 | 1,998,184 | 3,430,502 | 4.13 |
| 85-89 | 615,608 | 1,046,633 | 1,662,241 | 2.00 |
| 90–94 | 200,432 | 471,151 | 671,583 | 0.81 |
| 95–99 | 30826 | 120,817 | 151,643 | 0.18 |
| 100–104 | 3122 | 13,587 | 16709 | 0.02 |
| 105–109 | 703 | 2417 | 3120 | <0.01 |
| 110+ | 186 | 450 | 636 | <0.01 |
| الفئة العمرية | ذكر | أنثى | المجموع | النسبة المئوية |
| 0–14 | 5,896,365 | 5,581,435 | 11,477,800 | 13.80 |
| 15-64 | 27,107,627 | 26,297,968 | 53,405,595 | 64.22 |
| 65+ | 8,022,527 | 10,249,109 | 18,271,636 | 21.97 |
القضايا الاجتماعية
تحدث معظم الولادات في ألمانيا في إطار الزواج. فمن بين 778,080 ولادة في عام 2019، كان 258,835 منها لأبوين غير متزوجين، [ 60 ] مما يعني أن حوالي 33%، أي ثلث الأطفال، يولدون خارج إطار الزواج، بينما يولد الثلثان داخله. وقد شهدت هذه النسبة من الولادات خارج إطار الزواج ارتفاعًا مستمرًا، حيث بلغت 33% في عام 2010، أي أكثر من ضعف ما كانت عليه في عام 1990. [ 61 ] إلا أنها بدأت في السنوات الأخيرة بالركود أو حتى الانخفاض. [ 62 ]
أظهر مسح ميكروزنسوس الذي أُجري عام 2008 أن عدد الأطفال لدى المرأة الألمانية التي تتراوح أعمارها بين 40 و75 عامًا يرتبط ارتباطًا وثيقًا بمستوى تعليمها. [ 63 ] في ألمانيا الغربية، سجلت النساء الحاصلات على تعليم جامعي أعلى معدلات عدم الإنجاب، حيث صرحت 26% منهن بأنهن بلا أطفال. وانخفضت هذه النسبة إلى 16% لدى الحاصلات على تعليم متوسط، و11% لدى الحاصلات على التعليم الإلزامي فقط. أما في ألمانيا الشرقية، فقد بلغت نسبة النساء غير المتزوجات من بين الأكثر تعليمًا في هذه الفئة العمرية 9%، و7% لدى الحاصلات على تعليم متوسط، بينما بلغت النسبة 12% لدى الحاصلات على التعليم الإلزامي فقط.
يعود سبب هذا الاختلاف بين الشرق والغرب إلى أن جمهورية ألمانيا الديمقراطية تبنت "برنامج الأم المتعلمة" وسعت جاهدةً لتشجيع الإنجاب الأول بين النساء الأكثر تعليماً. وقد فعلت ذلك من خلال الترويج لفكرة أن على كل امرأة متعلمة "إنجاب طفل واحد على الأقل للاشتراكية"، وكذلك من خلال تقديم مكافآت مالية للمواطنين الأكثر تعليماً لتشجيعهم على الإنجاب. وقد سعت الحكومة بشكل خاص إلى إقناع الطلاب بالإنجاب أثناء دراستهم الجامعية، ونجحت في ذلك إلى حد كبير. ففي عام 1986، كانت 38% من النساء اللواتي على وشك التخرج من الجامعة أمهات لطفل واحد على الأقل، بالإضافة إلى 14% منهن حوامل، بينما كان 43% من الرجال الذين على وشك التخرج من الجامعة آباءً لطفل واحد على الأقل. وقد شهد معدل المواليد انخفاضاً حاداً، وخاصةً بين المتعلمين، بعد سقوط جدار برلين. أما اليوم، فلا تتجاوز نسبة الآباء والأمهات بين خريجي الجامعات 5%.
كلما زاد مستوى تعليم الأم الألمانية الغربية التي تتراوح أعمارها بين 40 و 75 عامًا في عام 2008، قل احتمال أن يكون لديها عائلة كبيرة.
| عدد الأطفال | التعليم الإلزامي | التعليم المتوسط | أعلى مستويات التعليم |
|---|---|---|---|
| طفل واحد | 22 | 30 | 31 |
| طفلان | 39 | 48 | 48 |
| ثلاثة أطفال أو أكثر | 39 | 22 | 21 |
المصدر: [ 64 ]
وينطبق الأمر نفسه على أم تعيش في ألمانيا الشرقية عام 2008.
| عدد الأطفال | التعليم الإلزامي | التعليم المتوسط | أعلى مستويات التعليم |
|---|---|---|---|
| طفل واحد | 23 | 33 | 33 |
| طفلان | 37 | 46 | 51 |
| ثلاثة أطفال أو أكثر | 40 | 21 | 16 |
المصدر: [ 64 ]
في عام 2011، انعكس هذا الاتجاه في ألمانيا الشرقية، حيث أصبح معدل الخصوبة لدى النساء الأكثر تعليماً أعلى قليلاً من بقية السكان. [ 65 ]
يميل الأشخاص الذين صرحوا بأنهم لا يتبعون أي دين إلى إنجاب عدد أقل من الأطفال مقارنةً بمن يُعرّفون أنفسهم كمسيحيين، كما وجدت الدراسات أن المسيحيين ذوي الميول المحافظة لديهم عدد أكبر من الأطفال مقارنةً بالمسيحيين ذوي الميول الليبرالية. [ 66 ] [ 67 ]
كشفت دراسة أجراها الاتحاد الديمقراطي الألماني (HDZ) عام 2005 في ولاية شمال الراين وستفاليا غرب ألمانيا أن عدم الإنجاب منتشر بشكل خاص بين العلماء. وأظهرت الدراسة أن 78% من العالمات و71% من العلماء العاملين في تلك الولاية لم ينجبوا أطفالاً. [ 68 ]
التشرد
تُعدّ ظاهرة التشرد في ألمانيا مشكلة اجتماعية خطيرة، إذ يُقدّر عدد المتضررين منها بنحو 678,000 شخص، [ 69 ] من بينهم حوالي 372,000 شخص تُؤويهم الخدمات العامة، كالملاجئ البلدية للاجئين. [ 70 ] وبحلول عام 2017، ارتفع عدد المشردين في البلاد بنسبة 150% منذ عام 2014. [ 71 ] ويُذكر أن حوالي 22,000 من المشردين هم من الأطفال. [ 69 ]
بالإضافة إلى ذلك، لم تنشر الدولة بعد إحصاءات عن التشرد على المستوى الاتحادي [ 72 ] على الرغم من كونها مشكلة مستمرة ومنتشرة على نطاق واسع.
الأقليات العرقية والخلفية المهاجرة (الخلفية المهاجرة )
لا تجمع ألمانيا بيانات عن الهوية العرقية والإثنية لمواطنيها، ولكنها تجمع بيانات عن المجموعة الأصلية للفرد عند ولادته. [ 73 ] يُعرّف المكتب الاتحادي للإحصاء الأشخاص ذوي الخلفية المهاجرة بأنهم جميع الأشخاص الذين هاجروا إلى المنطقة الحالية لجمهورية ألمانيا الاتحادية بعد عام 1949، بالإضافة إلى جميع الرعايا الأجانب المولودين في ألمانيا، وجميع الأشخاص المولودين في ألمانيا كمواطنين ألمان، وكان أحد والديهم على الأقل قد هاجر إلى ألمانيا أو وُلد فيها كمواطن أجنبي. وتستند الأرقام المعروضة هنا إلى هذا التعريف فقط.
في عام 2010، بلغ عدد الأسر التي لديها أطفال دون سن 18 عامًا في ألمانيا 2.3 مليون أسرة، وكان أحد الوالدين على الأقل من أصول أجنبية. وشكّلت هذه الأسر 29% من إجمالي 8.1 مليون أسرة لديها أطفال قاصرون. وبالمقارنة مع عام 2005 - وهو العام الذي بدأ فيه التعداد المصغر بجمع معلومات تفصيلية عن السكان ذوي الخلفية المهاجرة - ارتفعت نسبة الأسر المهاجرة بنقطتين مئويتين. [ 74 ] وفي عام 2019، بلغت نسبة الأطفال دون سن الخامسة من ذوي الخلفية المهاجرة 40%. [ 75 ]
تقطن معظم العائلات ذات الأصول المهاجرة في غرب ألمانيا. ففي عام 2010، بلغت نسبة العائلات المهاجرة 32% من إجمالي العائلات في ألمانيا الغربية (التي كانت تُعرف سابقًا باسم جمهورية ألمانيا الاتحادية). وكان هذا الرقم أكثر من ضعف النسبة في الولايات الألمانية الجديدة (بما فيها برلين) حيث بلغت 15%. [ 74 ] وتشهد ألمانيا الشرقية نسبة أقل بكثير من المهاجرين مقارنةً بالغرب، نظرًا لأن ألمانيا الشرقية لم تسمح بدخول أعداد كبيرة من العمالة الوافدة، ولأن اقتصادها لم يكن مزدهرًا كاقتصاد ألمانيا الغربية، كما كانت نسبة البطالة فيها أعلى حتى وقت قريب. مع ذلك، شهدت ألمانيا الشرقية في السنوات الأخيرة تزايدًا في عدد الأشخاص ذوي الأصول المهاجرة، وذلك نتيجةً لتوزيع اللاجئين (وكذلك العائدين الألمان) وفقًا لقانون "مفتاح كونيغشتاينر"، الذي يُلزم كل ولاية ألمانية باستقبال العدد نفسه من المهاجرين بما يتناسب مع عدد سكانها واقتصادها. في عام 2019، بلغ عدد سكان ألمانيا الغربية (باستثناء برلين) من أصول مهاجرة 19.036 مليون نسمة، أي ما يعادل 89.6% من إجمالي السكان، وهو ما يمثل 28.7% من إجمالي السكان. في المقابل، بلغ عدد سكان الولايات الشرقية من أصول مهاجرة 1.016 مليون نسمة، أي ما يعادل 4.8% من إجمالي السكان، وهو ما يمثل 8.2% من إجمالي السكان. أما في برلين، فقد بلغ عدد سكانها من أصول مهاجرة 1.194 مليون نسمة، أي ما يعادل 5.6% من إجمالي السكان، وهو ما يمثل 33.1% من إجمالي السكان. [ 75 ]
في عام 2019، بلغت نسبة الألمان الذين لديهم أحد الوالدين على الأقل مولودًا في الخارج 26% من جميع الفئات العمرية (مقارنةً بـ 18.4% في عام 2008)، و39% من الأطفال الألمان (مقارنةً بـ 30% في عام 2008). وبلغ متوسط عمر الألمان الذين لديهم أحد الوالدين على الأقل مولودًا في الخارج 35.6 عامًا (مقارنةً بـ 33.8 عامًا في عام 2008)، بينما بلغ متوسط عمر الألمان الذين لديهم كلا الوالدين مولودين في ألمانيا 47.3 عامًا (مقارنةً بـ 44.6 عامًا في عام 2008). [ 75 ] [ 76 ]
في عام 2022، كان 41% من الفئة العمرية الأقل من 15 عامًا من أصول مهاجرة، و36% من الفئة العمرية من 15 إلى 49 عامًا من أصول مهاجرة، و19% من الفئة العمرية الأكبر من 50 عامًا. [ 77 ]
أكبر مجموعات الأشخاص ذوي الخلفية المهاجرة في ألمانيا هم الأشخاص الذين ينحدرون من تركيا وبولندا وروسيا كأوطان أجدادهم.
اعتبارًا من عام 2022وكان توزيع السكان حسب الخلفية كما يلي:

عدد سكان ألمانيا في عام 2022
- الألمان [ 78 ] (71.3%)
- تركي (3.40%)
- البولندية (2.60%)
- الروسية (1.60%)
- الكازاخستاني (1.60%)
- سوري (1.50%)
- الروماني (1.30%)
- إيطالي (1.10%)
- أوروبي (أخرى) (7.70%)
- آسيوي (أخرى) (3.70%)
- أمريكا (الشمال والجنوب) (0.80%)
- أفريقيا جنوب الصحراء الكبرى (0.80%)
- دول المغرب العربي (0.60%)
- أخرى/غير محددة/مختلطة (2.00%)
| مجموعة الخلفية | سنة | |||||||||
|---|---|---|---|---|---|---|---|---|---|---|
| 2005 [ 79 ] [ 80 ] | 2011 [ 81 ] [ 80 ] | 2016 [ 82 ] [ 80 ] | 2022 [ 80 ] | 2025 [ 80 ] | ||||||
| رقم | % | رقم | % | رقم | % | رقم | % | رقم | % | |
| أوروبي | ||||||||||
| إجمالي | 72,625,000 | 89.2% | 71,111,000 | 85.5% | 71,407,000 | 85.1% | ||||
 دول الاتحاد الأوروبي الـ 27 دول الاتحاد الأوروبي الـ 27 | ||||||||||
| بدون خلفية مهاجرة | 66,413,000 | 81.3% | 64,551,000 | 81.4% | 62,989,000 | 77.4% | 59,278,000 | 71.3% | 58,968,000 | 70.3% |
 البولنديون (بما في ذلك العائدون من أصل ألماني من بولندا ) البولنديون (بما في ذلك العائدون من أصل ألماني من بولندا ) | 1,046,000 | 1,424,000 | 1,868,000 | 2.3% | 2,201,000 | 2.6% | 2,245,000 | 2.6% | ||
 الرومانيون (بما في ذلك العائدون من رومانيا من أصل ألماني ) الرومانيون (بما في ذلك العائدون من رومانيا من أصل ألماني ) | 406,000 | 472,000 | 788,000 | 1% | 1,096,000 | 1.3% | 1,114,000 | 1.4% | ||
 الإيطاليون (بما في ذلك سكان جنوب تيرول العرقيين ) الإيطاليون (بما في ذلك سكان جنوب تيرول العرقيين ) | 794,000 | 701,000 | 861,000 | 1.1% | 905,000 | 1.1% | 828,000 | 1.0% | ||
 اليونانية اليونانية | 386,000 | 349,000 | 443,000 | 0.5% | 434,000 | 0.5% | 435,000 | 0.5% | ||
 كرواتي كرواتي | 410,000 | 325,000 | 441,000 | 0.5% | 419,000 | 0.5% | 359,000 | 0.5% | ||
 النمساوي النمساوي | 309,000 | 254,000 | 280,000 | 0.3% | 353,000 | 0.4% | 336,000 | 0.4% | ||
 البلغارية البلغارية | 49000 | 77000 | 238,000 | 0.3% | 340,000 | 0.4% | 382,000 | 0.4% | ||
 الأسبانية الأسبانية | 173,000 | 142,000 | 209,000 | 0.3% | 233,000 | 0.3% | 237,000 | 0.3% | ||
 هولندي هولندي | 190,000 | 203,000 | 206,000 | 0.3% | 233,000 | 0.3% | 207,000 | 0.3% | ||
 فرنسي فرنسي | 157,000 | 153,000 | 168,000 | 0.2% | 228,000 | 0.3% | 224,000 | 0.3% | ||
| الدول الأعضاء الأخرى في الاتحاد الأوروبي ( وخاصة المجرية والتشيكية والبرتغالية ) | 824,000 | 1% | 1,129,000 | 1.4% | 1,122,000 | 1.3% | ||||
| إجمالي | 69,315,000 | 85.1% | 66,849,000 | 80.4% | 66,533,000 | 79.3% | ||||
| أوروبيون آخرون | ||||||||||
 الروس (بما في ذلك العائدون من أصل ألماني من روسيا ) الروس (بما في ذلك العائدون من أصل ألماني من روسيا ) | 1,290,000 | 1,189,000 | 1,223,000 | 1.5% | 1,354,000 | 1.6% | 1,365,000 | 1.6% | ||
 الأوكرانية الأوكرانية | – | 246,000 | 272,000 | 0.3% | 583,000 | 0.7% | 1,355,000 | 1.2% | ||
 كوسوفو كوسوفو | – | 270,000 | 356,000 | 0.4% | 542,000 | 0.7% | 615,000 | 0.7% | ||
 البوسني البوسني | 329,000 | 202,000 | 248,000 | 0.3% | 538,000 | 0.6% | 554,000 | 0.7% | ||
 صربي صربي | 263,065 | 252,000 | 288,000 | 0.4% | 382,000 | 0.5% | 367,000 | 0.5% | ||
| آخرون ( مقدونيون وسويسريون وبريطانيون في المقام الأول ) | 923,000 | 1.1% | 863,000 | 1% | 950,000 | 1.1% | ||||
| إجمالي | 3,310,000 | 4.1% | 4,262,000 | 5.1% | 4,874,000 | 5.8% | ||||
| الآسيويون | ||||||||||
 الأتراك (بما في ذلك الأكراد العرقيين ) الأتراك (بما في ذلك الأكراد العرقيين ) | 2,766,000 | 2,643,000 | 2,797,000 | 3.4% | 2,835,000 | 3.4% | 3,081,000 | 3.5% | ||
 الكازاخستانيون (بما في ذلك العائدون من أصل ألماني من كازاخستان ) الكازاخستانيون (بما في ذلك العائدون من أصل ألماني من كازاخستان ) | – | 917,000 | 969,000 | 1.2% | 1,325,000 | 1.6% | 1,335,000 | 1.6% | ||
 سوري (بما في ذلك الأكراد العرقيين ) سوري (بما في ذلك الأكراد العرقيين ) | – | 53000 | 521,000 | 0.6% | 1,225,000 | 1.5% | 1,281,000 | 1.5% | ||
 أفغاني أفغاني | 88000 | 131,000 | 231,000 | 0.3% | 435,000 | 0.5% | 515,000 | 0.6% | ||
 عراقي (بما في ذلك الأكراد العرقيين ) عراقي (بما في ذلك الأكراد العرقيين ) | 113,000 | 106,000 | 206,000 | 0.3% | 393,000 | 0.5% | 362,000 | 0.5% | ||
 الإيرانيون (بما في ذلك الأكراد العرقيون ) الإيرانيون (بما في ذلك الأكراد العرقيون ) | 150,000 | 130,000 | 164,000 | 0.2% | 304,000 | 0.4% | 334,000 | 0.4% | ||
 الصينية الصينية | 80,000 | 93000 | 157,000 | 0.2% | 217,000 | 0.3% | 220,000 | 0.3% | ||
 الفيتناميين الفيتناميين | 150,000 | 146,000 | 167,000 | 0.2% | 236,000 | 0.2% | 239,000 | 0.2% | ||
| آحرون | 1,006,000 | 1.2% | 1,554,000 | 1.9% | 1,662,000 | 2.0% | ||||
| إجمالي | 6,218,000 | 7.6% | 8,495,000 | 10.3% | 8,842,000 | 10.5% | ||||
| الأفريقي | ||||||||||
| أفريقيا جنوب الصحراء | 222,000 | 246,000 | 395,000 | 0.5% | 660,000 | 0.8% | 711,000 | 0.8% | ||
 مغربي مغربي | 147,000 | 141,000 | 191,000 | 0.2% | 257,000 | 0.3% | 284,000 | 0.3% | ||
| دول المغرب العربي الأخرى: | 108,000 | 121,000 | 158,000 | 0.2% | 242,000 | 0.3% | 281,000 | 0.3% | ||
| إجمالي | 477,000 | 508,000 | 744,000 | 0.9% | 1,159,000 | 1.4% | 1,270,000 | 1.5% | ||
| الأمريكتين | ||||||||||
 أمريكي أمريكي | 140,000 | 123,000 | 154,000 | 0.2% | 216,000 | 0.3% | 229,000 | 0.3% | ||
| شعوب أخرى من الأمريكتين | 191,000 | 201,000 | 267,000 | 0.3% | 466,000 | 0.5% | 499,000 | 0.6% | ||
| إجمالي | 331,000 | 324,000 | 421,000 | 0.5% | 682,000 | 0.8% | 714,000 | 0.8% | ||
| أستراليا / أوقيانوسيا | ||||||||||
| إجمالي | – | 40,000 | 0.05% | 26000 | 0.03% | 29000 | 0.03% | |||
| أخرى/غير محددة/مختلطة | ||||||||||
| إجمالي | 2,536,000 | 1,310,000 | 1,381,000 | 1.7% | 1,628,000 | 1.9% | 1,613,000 | 1.9% | ||
| المجموع: خلفية أجنبية | ||||||||||
| إجمالي | 15,227,000 | 14,796,000 | 18,443,000 | 22.6% | 23,825,000 | 28.7% | 24,907,000 | 29.7% | ||
| المجموع | 81,640,000 | 79,347,000 | 81,432,000 | 100% | 83,103,000 | 100% | 83,875,000 | 100% | ||
- التركيبة العمرية لخلفيات الهجرة في ألمانيا عام 2021
 التركيبة العمرية حسب خلفية الهجرة في ألمانيا عام 2021
 بدون بنية عمرية خلفية للهجرة
 مع خلفية الهجرة
 أحد الوالدين لديه خلفية هجرة
 تتمتع سيمون هاوسوالد بخلفية هجرة بسبب كون والدتها كورية .
 يُصنف مسعود أوزيل على أنه من أصول مهاجرة لأن كلا والديه ولدا في تركيا.
 تتمتع هيلين فيشر بخلفية مهاجرة على الرغم من كونها ألمانية عرقياً لأنها ولدت في الاتحاد السوفيتي لأبوين من الأقلية الألمانية في روسيا.
تُعرف أربع مجموعات سكانية كبيرة أخرى باسم "الأقليات القومية" ( nationale Minderheiten ) نظرًا لسكنها في مناطقها لقرون: الدنماركيون ، والفريزيون ، والغجر والسنتي ، والصرب . توجد أقلية دنماركية (حوالي 50,000 نسمة ، وفقًا لمصادر حكومية) في ولاية شليسفيغ هولشتاين، أقصى شمال ألمانيا. ويعيش الفريزيون الشرقيون والشماليون على الساحل الغربي لشليسفيغ هولشتاين، وفي الجزء الشمالي الغربي من ساكسونيا السفلى . وهم جزء من مجتمع أوسع ( فريزيا ) يمتد من ألمانيا إلى شمال هولندا . أما الصرب ، وهم شعب سلافي يبلغ تعداده حوالي 60,000 نسمة (وفقًا لمصادر حكومية)، فيسكنون منطقة لوساتيا في ساكسونيا وبراندنبورغ . وهم آخر ما تبقى من السلاف الذين سكنوا وسط وشرق ألمانيا منذ القرن السابع الميلادي ، والذين حافظوا على تقاليدهم ولم يندمجوا تمامًا في الأمة الألمانية الأوسع.
حتى الحرب العالمية الثانية، كان البولنديون معترفًا بهم كإحدى الأقليات القومية. في عام ١٩٢٤، بدأ اتحاد البولنديين في ألمانيا تعاونًا بين جميع الأقليات القومية في ألمانيا تحت مظلة منظمة رابطة الأقليات القومية في ألمانيا . كان بعض أعضاء الاتحاد يرغبون في انضمام الجاليات البولندية في أقصى شرق ألمانيا ( بولندا حاليًا ) إلى الأمة البولندية المُنشأة حديثًا بعد الحرب العالمية الأولى . [ ٨٣ ] حتى قبل الغزو الألماني لبولندا، تم ترحيل أبرز الشخصيات المناهضة للنازية من الأقلية البولندية إلى معسكرات الاعتقال؛ وأُعدم بعضهم في موقع مذبحة بياشنيتسا. أُلغيت حقوق الأقليات البولندية في ألمانيا بموجب مرسوم هيرمان غورينغ الصادر في ٢٧ فبراير ١٩٤٠، وصودرت ممتلكاتهم.
بعد انتهاء الحرب، لم تُعد الحكومة الألمانية العمل بحقوق الأقليات القومية للبولنديين. ويعود السبب في ذلك إلى ضم المناطق الألمانية التي كانت تضم أقلية بولندية إلى بولندا والاتحاد السوفيتي، بينما فرّ معظم السكان الألمان الأصليين (الذين كانوا يشكلون الأغلبية سابقًا) في هذه المناطق أو طُردوا بالقوة . ومع فقدان الأراضي المختلطة الألمانية البولندية، اعتبرت الحكومة الألمانية البولنديين المقيمين فيما تبقى من ألمانيا مهاجرين، تمامًا كأي مجموعة عرقية أخرى وصلت حديثًا. في المقابل، يُعترف بالألمان المقيمين في بولندا كأقلية قومية، وقد مُنحوا مقاعد في البرلمان البولندي. مع ذلك، تجدر الإشارة إلى أن غالبية الألمان في بولندا تربطهم علاقات تاريخية عريقة بالأراضي التي يسكنونها، سواءً من خلال سكنهم في أراضٍ كانت تابعة للدولة الألمانية، أو من خلال مجتمعات عريقة. في المقابل، يُعدّ معظم البولنديين في ألمانيا اليوم مهاجرين حديثين، على الرغم من وجود بعض المجتمعات التي يعود تاريخها إلى القرن التاسع عشر، وربما حتى القرن الثامن عشر. على الرغم من احتجاجات البعض في المجتمعات البولندية الألمانية القديمة، وعلى الرغم من أن ألمانيا أصبحت الآن دولة موقعة على الاتفاقية الإطارية لحماية الأقليات القومية، إلا أن ألمانيا رفضت حتى الآن إعادة تطبيق حقوق الأقليات للبولنديين العرقيين، وذلك استناداً إلى حقيقة أن جميع المناطق تقريباً ذات التراث الألماني البولندي المختلط تاريخياً (حيث كانت حقوق الأقليات موجودة سابقاً) لم تعد جزءاً من ألمانيا، ولأن الغالبية العظمى من البولنديين العرقيين المقيمين حالياً في ألمانيا هم مهاجرون حديثون.
تواجد شعب الروما في ألمانيا منذ العصور الوسطى . تعرضوا للاضطهاد من قبل النازيين ، وقُتل آلاف منهم على يد النظام النازي. ينتشرون اليوم في جميع أنحاء ألمانيا، ويقطن معظمهم في المدن الكبرى. يصعب تقدير عددهم بدقة، إذ تصنفهم الحكومة الألمانية ضمن فئة "الأشخاص غير المهاجرين" في إحصاءاتها. كما يوجد أيضاً عدد كبير من السنتي والروما المندمجين في المجتمع. وتشير تقديرات وزارة الداخلية الألمانية إلى أن عددهم يبلغ حوالي 70 ألف نسمة. وعلى عكس الروما الأصليين، فإن غالبيتهم لا يحملون الجنسية الألمانية، ويُصنفون كمهاجرين أو لاجئين .

بعد الحرب العالمية الثانية، طُرد 14 مليون ألماني من أصول عرقية من الأراضي الشرقية لألمانيا ومناطقهم الأصلية خارج الإمبراطورية الألمانية السابقة. وشكّل استيعاب هؤلاء المهاجرين ودمجهم في الجزء المتبقي من ألمانيا، الذي دُمرت فيه مدن عديدة وملايين الشقق، جهداً كبيراً في مناطق الاحتلال التي أعقبت الحرب، وفي الولايات الألمانية اللاحقة.
منذ ستينيات القرن الماضي، قدم إلى ألمانيا أفراد من أصول ألمانية من جمهورية بولندا الشعبية والاتحاد السوفيتي (وخاصة من كازاخستان وروسيا وأوكرانيا ). وخلال فترة البيريسترويكا ، وبعد تفكك الاتحاد السوفيتي، ازداد عدد المهاجرين بشكل ملحوظ. بعض هؤلاء المهاجرين من أصول مختلطة. خلال الفترة الممتدة من عام 1987 إلى عام 2001، هاجر ما مجموعه 1,981,732 ألمانيًا من دول الاتحاد السوفيتي السابق إلى ألمانيا، بالإضافة إلى أكثر من مليون من أقاربهم غير الألمان. بعد عام 1997، فاق عدد السلاف أو ذوي الأصول السلافية الجرمانية المختلطة عدد ذوي الأصول الجرمانية فقط بين المهاجرين. يبلغ إجمالي عدد الأشخاص المقيمين حاليًا في ألمانيا ممن لهم صلة بدول الاتحاد السوفيتي السابق حوالي 4 إلى 4.5 مليون نسمة (بما في ذلك الألمان والسلاف واليهود وذوي الأصول المختلطة)، أكثر من 50% منهم من أصول ألمانية. [ 84 ] [ 85 ]
تضم ألمانيا حاليًا ثالث أكبر جالية يهودية في أوروبا. في عام ٢٠٠٤، استقر في ألمانيا ضعف عدد اليهود القادمين من جمهوريات الاتحاد السوفيتي السابق مقارنةً بمن استقروا في إسرائيل ، ليصل إجمالي عدد الوافدين إلى أكثر من ١٠٠ ألف يهودي منذ عام ١٩٩١. [ ٨٦ ] ولليهود صوت مسموع في الحياة العامة الألمانية من خلال المجلس المركزي لليهود في ألمانيا . بعض اليهود القادمين من الاتحاد السوفيتي السابق من أصول مختلطة. اليوم، لا تتجاوز نسبة اليهود في ألمانيا ٠.١٪ من إجمالي السكان.
في عام ٢٠١٩، ازداد عدد الألمان ذوي الأصول الأفريقية، والذين يُعرّفون بأنهم أشخاص من أصول أفريقية مهاجرة، ليصل إلى ٥٢٩ ألفًا على الأقل. [ ٧٥ ] من بينهم، يحمل أكثر من ٤٠٠ ألف جنسية دولة من دول أفريقيا جنوب الصحراء الكبرى، [ ٨٧ ] بينما يحمل الباقون الجنسية الألمانية. ويقيم معظمهم في برلين وهامبورغ . كما يعيش في ألمانيا عدد كبير من الأشخاص من شمال أفريقيا ، وتحديدًا من تونس والمغرب . ورغم أنهم يُعتبرون من الأقليات، إلا أنهم في الغالب لا يعتبرون أنفسهم "ألمانًا من أصول أفريقية"، ولا ينظر إليهم الشعب الألماني على هذا النحو. مع ذلك، لا تحتفظ ألمانيا بأي إحصاءات تتعلق بالأصل العرقي أو الإثني، وبالتالي، يبقى العدد الدقيق للألمان من أصول أفريقية غير معروف.
أكبر جالية من شرق آسيا في ألمانيا هي الجالية الصينية ، التي يبلغ تعدادها 189,000 نسمة [ 75 ] والجالية الفيتنامية ، التي يبلغ تعدادها 188,000 نسمة [ 75 ] ، ويقطن معظمهم في برلين وشرق ألمانيا. كما يوجد حوالي 35,000 مواطن ياباني مقيم في ألمانيا. [ 88 ] وتوجد أيضًا جاليات من المهاجرين من جنوب وجنوب شرق آسيا ، حيث يعيش حوالي 163,000 هندي و124,000 باكستاني في ألمانيا. [ 75 ] بالإضافة إلى ذلك، يقيم حوالي 30,000 مواطن فلبيني وأكثر من 20,000 مواطن إندونيسي في ألمانيا. [ 88 ]
يعيش العديد من أحفاد ما يُعرف بالعمالة الوافدة (Gastarbeiter) في ألمانيا. وقدِم معظم هؤلاء العمال من تركيا وإيطاليا واليونان وإسبانيا والمغرب والبرتغال ويوغوسلافيا السابقة وتونس وتشيلي. كما شملت القائمة فيتنام ومنغوليا وكوريا الشمالية وأنغولا وموزمبيق وكوبا ، وذلك خلال فترة وجود ألمانيا الشرقية السابقة وحتى إعادة توحيدها عام 1990. [ 89 ] إلا أن جمهورية ألمانيا الديمقراطية ( الاشتراكية ) ( ألمانيا الشرقية ) كانت تُقيم عمالها الوافدين في مساكن منفصلة للجنسين. [ 90 ] وكان على العاملات الوافدات توقيع عقود تنص على عدم السماح لهن بالحمل خلال فترة إقامتهن. وإذا حملن، فإنهن يواجهن الإجهاض القسري أو الترحيل. [ 91 ] وهذا أحد أسباب وجود الغالبية العظمى من الأقليات العرقية اليوم في غرب ألمانيا، وأحد أسباب امتلاك أقليات مثل الفيتناميين لهرم سكاني غير مألوف ، حيث وُلد جميع الجيل الثاني تقريبًا من الألمان الفيتناميين بعد عام 1989.


الأجانب في ألمانيا

في نهاية عام 2023، كانت أكثر مجموعات المقيمين الأجانب شيوعًا في ألمانيا على النحو التالي: [ 95 ]
لا تشمل هذه القائمة غير الألمان من أصل ألماني الذين يحملون الجنسية الألمانية والأجانب الذين لا يحملون وضع الإقامة.
| رتبة | جنسية | عدد السكان (تم تصحيحه بناءً على تعداد عام 2022) | غيّر عام 2023 إلى عام 2024 | ||
|---|---|---|---|---|---|
| 31 ديسمبر 2022 | 31 ديسمبر 2023 | 31 ديسمبر 2024 | |||
| المجموع | 11,495,135 | 12,108,988 | 12,392,275 | 283,287 | |
| 1 | ديك رومى | 1,323,571 | 1,391,800 | 1,402,783 | 10983 |
| 2 | أوكرانيا | 863,335 | 974,322 | 1,085,298 | 110,976 |
| 3 | سوريا | 829,143 | 879,823 | 889,482 | 9659 |
| 4 | رومانيا | 753,056 | 776,424 | 771,276 | -5,148 |
| 5 | بولندا | 732,191 | 741,784 | 723,151 | -18,633 |
| 6 | إيطاليا | 573,632 | 571,379 | 564,547 | -6,832 |
| 7 | أفغانستان | 330,834 | 377,986 | 404,269 | 26283 |
| 8 | كرواتيا | 399,547 | 395,562 | 384,451 | -11,111 |
| 9 | بلغاريا | 366,026 | 371,128 | 362,421 | -8,707 |
| 10 | كوسوفو | 276,231 | 294,906 | 309,435 | 14,529 |
| 11 | اليونان | 305,821 | 303,375 | 298,398 | -4,977 |
| 12 | روسيا | 257,565 | 272,362 | 266,385 | -5,977 |
| 13 |  الهند الهند | 187,325 | 224,566 | 264,832 | 40,266 |
| 14 | صربيا | 239,580 | 249,590 | 252,808 | 3218 |
| 15 | العراق | 239,740 | 239,278 | 229,916 | -9,362 |
| 16 | البوسنة والهرسك | 209,845 | 222,235 | 227,689 | 5454 |
| 17 |  هنغاريا هنغاريا | 181,007 | 187,162 | 184,836 | -2326 |
| 18 | إسبانيا | 167,407 | 172,456 | 175,638 | 3182 |
| 19 | النمسا | 166,518 | 165,518 | 163,916 | -1,602 |
| 20 | الصين | 130,993 | 139,818 | 149,736 | 9918 |
| 21 |  مقدونيا الشمالية مقدونيا الشمالية | 131,987 | 143,680 | 147,714 | 4034 |
| 22 | إيران | 122,327 | 135,564 | 144,336 | 8772 |
| 23 | هولندا | 133,321 | 133,248 | 132,606 | -642 |
| 24 | فرنسا | 120,814 | 121,149 | 120205 | -944 |
| 25 | فيتنام | 97,486 | 107,677 | 120,045 | 12368 |
| 26 |  البرتغال البرتغال | 117,966 | 119,065 | 119,654 | 589 |
| 27 |  ألبانيا ألبانيا | 93,382 | 109,108 | 118,697 | 9589 |
| 28 | الولايات المتحدة | 105,233 | 108,621 | 110,391 | 1770 |
| 29 | المغرب | 79,423 | 86,960 | 92,814 | 5854 |
| 30 |  باكستان باكستان | 72,786 | 82,019 | 88,594 | 6575 |
الكثافة السكانية والتوزيع

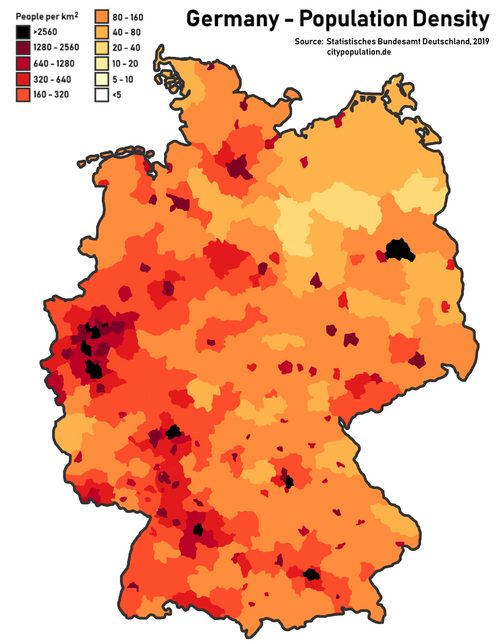
يبلغ عدد سكان ألمانيا حوالي 83.2 مليون نسمة في ديسمبر 2020، [ 96 ] مما يجعلها ثاني أكبر دولة من حيث عدد السكان في أوروبا بعد روسيا، وتحتل المرتبة التاسعة عشرة عالميًا من حيث عدد السكان. وتبلغ الكثافة السكانية فيها 233 نسمة لكل كيلومتر مربع.
الولايات
تتألف ألمانيا من ست عشرة ولاية تُعرف مجتمعةً باسم "لاندر" (Länder ). [ 97 ] ونظرًا لاختلاف مساحتها وعدد سكانها، يتباين تقسيم هذه الولايات ، لا سيما بين المدن ( Stadtstaaten ) والولايات ذات المساحات الأكبر ( Flächenländer ). ولأغراض الإدارة الإقليمية، تتألف أربع ولايات، هي بادن-فورتمبيرغ، وبافاريا، وهيسن، وشمال الراين-وستفاليا، من 19 منطقة حكومية ( Regierungsbezirke ). واعتبارًا من عام 2019، قُسّمت ألمانيا إلى 400 مقاطعة ( Kreise ) على مستوى البلديات؛ تتألف هذه المقاطعات من 294 مقاطعة ريفية و106 مقاطعات حضرية .


| ولاية | عاصمة | المساحة ( كم² ) | عدد السكان [ 98 ] (31 ديسمبر 2022) | الأجانب | الكثافة السكانية (لكل كيلومتر مربع ) |
|---|---|---|---|---|---|
| شمال الراين وستفاليا | دوسلدورف | 34112 | 18,139,116 | 2,828,367 | 532 |
| بافاريا | ميونخ | 70,541 | 13,369,116 | 2,073,494 | 190 |
| بادن-فورتمبيرغ | شتوتغارت | 35,748 | 11,280,257 | 2,012,237 | 316 |
| ساكسونيا السفلى | هانوفر | 47,709 | 8,140,242 | 959,786 | 171 |
| هيس | فيسبادن | 21116 | 6,391,360 | 1,199,775 | 303 |
| راينلاند بالاتينات | ماينز | 19858 | 4,159,150 | 566,026 | 209 |
| ساكسونيا | دريسدن | 18450 | 4,086,152 | 300,164 | 221 |
| برلين | برلين | 891 | 3,755,251 | 834,349 | 4215 |
| شليسفيغ هولشتاين | كيل | 15804 | 2,953,270 | 299,787 | 187 |
| براندنبورغ | بوتسدام | 29,654 | 2,573,135 | 179,872 | 87 |
| Saxony-Anhalt | Magdeburg | 20,454 | 2,186,643 | 160,990 | 107 |
| Thuringia | Erfurt | 16,202 | 2,126,846 | 161,291 | 131 |
| Hamburg | Hamburg | 755 | 1,892,122 | 363,283 | 2,506 |
| Mecklenburg-Vorpommern | Schwerin | 23,295 | 1,628,378 | 105,437 | 70 |
| Saarland | Saarbrücken | 2,571 | 992,666 | 139,189 | 386 |
| Bremen | Bremen | 419 | 684,864 | 144,148 | 1,634 |
| Germany | Berlin | 357,582 | 84,358,845 | 12,324,195 | 236 |
Urbanization
Germany officially has eleven metropolitan regions. In 2005, Germany had 82 cities with more than 100,000 inhabitants.
| Metropolitan region | Location | Description | Approx.population(millions) | Large minority groups |
|---|---|---|---|---|
| Rhine-Ruhr | 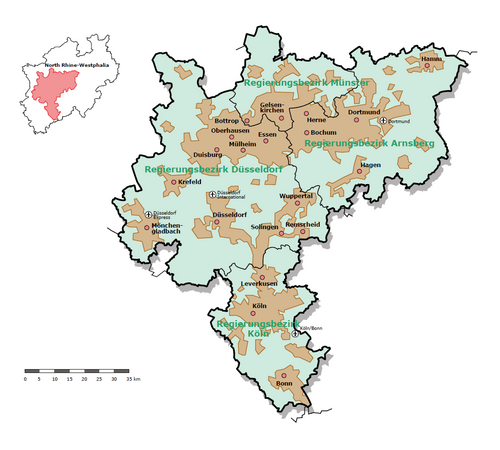 | The metropolitan area is part of the pan-European Blue Banana mega region and is a significant industrial and commercial hub, home to many of Germany's biggest corporations and contributing as much as 15% to the German GDP. Included in the rather polycentric conurbation are the cities of Cologne, Düsseldorf, Bonn, Dortmund and Essen served by two of the country's largest airports: Düsseldorf Airport and the Cologne Bonn Airport. Particularly among young Germans, Cologne and Düsseldorf are known for their nightlife and open-minded atmosphere. | 10 | Turks, Poles, Italians, Romanians, Africans, Arabs, Greeks, Dutch, Russians, Serbs, Bulgarians and Spaniards |
| Berlin/Brandenburg |  | Berlin is the capital and largest city. It lies in the eastern part of the country, completely surrounded by the rather sparsely populated state of Brandenburg. Berlin is regarded as one of Europe's most open, vibrant and ever changing capitals. The city is arguably the most diverse city in Germany regarding culture and ethnicity. Regarded as an economically weak region of Germany for a long time, it is now transforming itself into the entrepreneurial center of Europe. Dubbed the "Silicon Allee" by insiders of the tech industry, Berlin is home to countless startup companies and is one of Germany's densest knowledge hubs, with four public universities and countless research centers. | 6 | Turks, Russians, Poles, Africans, Italians, Americans, Vietnamese, Serbs, Arabs, Bulgarians, Romanians, French and Spaniards |
| Munich |  | The metropolitan area in and around Munich has one of Germany's highest standards of living. Housing some of the country's largest car and machine companies, it is known for its economic strength mixed with the uniqueness of Bavarian culture, taking up almost the entirety of southern Bavaria. It is the closest metropolitan area to the Alps. | 5.7 | Turks, Albanians, Croats, Italians, Poles, Greeks, Austrians, Romanians, Arabs, Africans and Serbs |
| Rhine-Main | 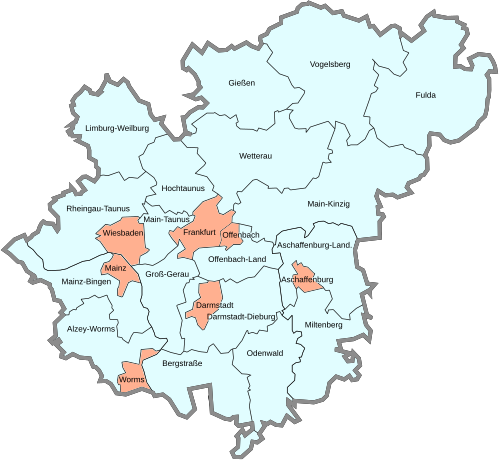 | Frankfurt is a financial and commercial center both for Germany and continental Europe. Almost all of Germany's big banks and the ECB have their headquarters located inside the city of Frankfurt. Despite its population of under 1 million, it is Germany's only city with a large, visible cluster of skyscrapers. The city is one of Europe's biggest transit hubs, with Europe's 6th busiest airport (Frankfurt airport), Germany's second-busiest railway station and one of the EU's most heavily used motorway interchanges. | 5.5 | Turks, Poles, Italians, African, Croats, Romanians, Greeks, Serbs, Spaniards, Americans, Chinese, Arabs and Indians |
| Hamburg |  | Hamburg is the country's second largest city and the biggest Hanseatic city in Europe. It is Europe's 3rd busiest container port with just under 9 million TEUs annually. The city is proud of its diverse nightlife and music scene centered in and around the famous St. Pauli district. | 5.3 | Turks, Albanians, Poles, African, Portuguese, Romanians, Russians, Italians and Spaniards |
| Stuttgart | 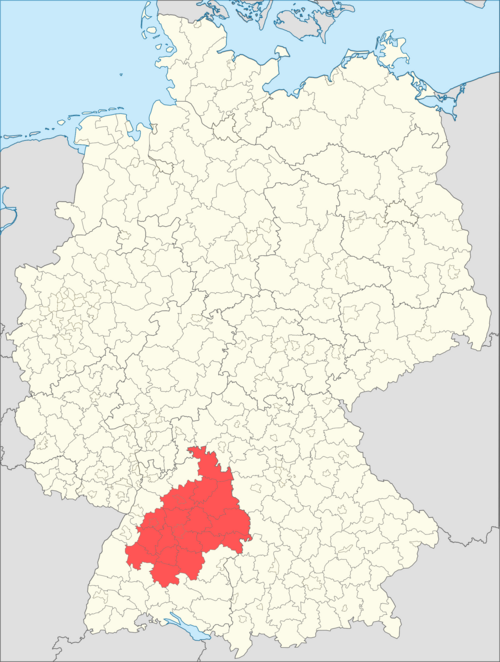 | Stuttgart has a reputation for research, inventions and industry. The German headquarters of many international enterprises are in Stuttgart. This contrasts with the strong rural, down-to-earth attitude of the Stuttgarters of all classes. A popular slogan is "We are good at everything. Except speaking High (standard) German." | 5.2 | Turks, Albanians, Greeks, Dutch, Italians, Croats, Serbs, French, Chinese, Romanians, Americans and Spaniards. |
| Hannover–Braunschweig–Göttingen–Wolfsburg |  | The relatively urban south of Lower Saxony, located on route between the Ruhr area and Berlin, and the route from Hamburg to the south, has been important for logistics, industry, but has also developed a strong standing in the service industries. | 3.7 | Turks, Kurds (especially around Celle), Serbs, Ukrainians, Greeks, Russians, Italians (especially in Wolfsburg) and Spanish (Especially in Hanover). |
| Bremen/Oldenburg |  | Located in the northwestern part of Germany, the main axis contains the cities of Bremen, Delmenhorst and Oldenburg, with the cities of Wilhelmshaven and Bremerhaven being the northern corners on or connected to the North Sea. Major rural areas are covered in between these cities. There is a smooth transition to the Hamburg metropolitan area to the east. | 2.7 | Turks, Russians, Albanians, Serbs, Portuguese, Iranians, Dutch, Americans and Britons. |
| Central German Metropolitan Region |  | The economic region stretches across three federal states. The major city is Leipzig in Saxony; other important cities are Halle/Saale, Gera and Jena. The region is known for its universities and research, for its trade fairs and conventions, as a central distribution hub (Leipzig-Halle-Airport), as a center for chemical and industrial production, for the well preserved inner cities and for the developed classical and alternative cultural scene. Leipzig is one of the fastest-growing cities in Germany, with a rising economy. | 2.4 | Russians, Poles, Vietnamese, Italians, Romanians, Ukrainians, Chinese, Turks, Portuguese, people from Syria, from Kazakhstan and from Afghanistan.[99] |
Immigration
The United Nations Population Fund lists Germany as host to the third-highest number of international migrants worldwide, behind the United States and Saudi Arabia.[93] The largest ethnic group of non-German origin are the Turkish. Since the 1960s, West and later reunified Germany has attracted immigrants primarily from Southern and Eastern Europe as well as Turkey, many of whom (or their children) have acquired German citizenship over time. While most of these immigrants initially arrived as guest workers, changes to guest worker legislation allowed many to stay and to build lives in Germany.
Germany had signed special visa agreements with several countries in times of severe labour shortages or when particular skills were deficient within the country. During the 1960s and 1970s, agreements were signed with the governments of Turkey, Yugoslavia, Italy and Spain to help Germany overcome its severe labour shortage.
As of 2012, after Germany fully legalized visa-free immigrants from the eastern states of the EU, the largest sources of net immigration to Germany were other European countries, most importantly Poland, Romania, Bulgaria, Hungary, Italy, Spain, and Greece; notably, in the case of Turkey, German Turks moving to Turkey slightly outnumbered new immigrants in 2012,[100] however, in recent years there are more Turkish immigrants in Germany than emigrants again, including illegal Turkish migrants.
In 2015, there was a large increase in asylum applications following the 2015 refugee crisis, mainly due to the violent conflicts in Syria, Iraq and Afghanistan: 476,649 asylum applications were counted that year.[101] This number went up to even 745,545 in 2016 and began to decline after it.[15]
In 2022, some 23.8 million people in Germany, or 28.7% of the population have migrant background.[102]
Following the 2022 Russian invasion of Ukraine, over 1.06 million refugees from Ukraine were recorded in Germany as of April 2023.[103]
Migration between Germany and foreign countries, 1950 to 2025
| Year | Total | Germans | Non-Germans | ||||||
|---|---|---|---|---|---|---|---|---|---|
| Arrivals | Departures | Net migration | Arrivals | Departures | Net migration | Arrivals | Departures | Net migration | |
| 1950 | 96,140 | 78,148 | 17,992 | – | – | – | – | – | – |
| 1951 | 88,349 | 126,071 | −37,722 | – | – | – | – | – | – |
| 1952 | 88,089 | 135,796 | −47,707 | – | – | – | – | – | – |
| 1953 | 101,599 | 122,264 | −20,665 | – | – | – | – | – | – |
| 1954 | 111,490 | 136,212 | −24,722 | 64,637 | 107,381 | −42,744 | 46,853 | 28,831 | 18,022 |
| 1955 | 127,921 | 136,977 | −9,056 | 67,553 | 101,429 | −33,876 | 60,368 | 35,548 | 24,820 |
| 1956 | 159,086 | 168,101 | −9,015 | 76,581 | 119,880 | −43,299 | 82,505 | 48,221 | 34,284 |
| 1957 | 200,142 | 173,171 | 26,971 | 92,724 | 113,879 | −21,155 | 107,418 | 59,292 | 48,126 |
| 1958 | 212,520 | 161,865 | 50,655 | 94,238 | 97,854 | −3,616 | 118,282 | 64,011 | 54,271 |
| 1959 | 227,600 | 178,864 | 48,736 | 81,681 | 98,234 | −16,553 | 145,919 | 80,630 | 65,289 |
| 1960 | 395,016 | 218,574 | 176,442 | 77,331 | 94,133 | −16,802 | 317,685 | 124,441 | 193,244 |
| 1961 | 489,423 | 266,536 | 222,887 | 78,354 | 85,012 | −6,658 | 411,069 | 181,524 | 229,545 |
| 1962 | 566,465 | 326,339 | 240,126 | 71,984 | 78,657 | −6,673 | 494,481 | 247,682 | 246,799 |
| 1963 | 576,951 | 426,767 | 150,184 | 71,188 | 78,645 | −7,457 | 505,763 | 348,122 | 157,641 |
| 1964 | 698,609 | 457,767 | 240,842 | 73,125 | 86,319 | −13,194 | 625,484 | 371,448 | 254,036 |
| 1965 | 791,737 | 489,503 | 302,234 | 75,580 | 76,799 | −1,219 | 716,157 | 412,704 | 303,453 |
| 1966 | 702,337 | 608,775 | 93,562 | 69,841 | 73,540 | −3,699 | 632,496 | 535,235 | 97,261 |
| 1967 | 398,403 | 604,211 | −205,808 | 68,105 | 76,317 | −8,212 | 330,298 | 527,894 | −197,596 |
| 1968 | 657,513 | 404,301 | 253,212 | 67,951 | 71,676 | −3,725 | 589,562 | 332,625 | 256,937 |
| 1969 | 980,731 | 436,685 | 544,046 | 71,165 | 68,021 | 3,144 | 909,566 | 368,664 | 540,902 |
| 1970 | 1,042,760 | 495,675 | 547,085 | 66,528 | 61,023 | 5,505 | 976,232 | 434,652 | 541,580 |
| 1971 | 936,349 | 554,280 | 382,069 | 65,612 | 54,022 | 11,590 | 870,737 | 500,258 | 370,479 |
| 1972 | 852,549 | 568,610 | 283,939 | 65,387 | 54,164 | 11,223 | 787,162 | 514,446 | 272,716 |
| 1973 | 932,583 | 580,019 | 352,564 | 63,474 | 53,208 | 10,266 | 869,109 | 526,811 | 342,298 |
| 1974 | 601,013 | 635,613 | −34,600 | 62,439 | 55,168 | 7,271 | 538,574 | 580,445 | −41,871 |
| 1975 | 429,064 | 652,966 | −223,902 | 62,969 | 52,861 | 10,108 | 366,095 | 600,105 | −234,010 |
| 1976 | 476,286 | 569,133 | −92,847 | 88,983 | 53,695 | 35,288 | 387,303 | 515,438 | −128,135 |
| 1977 | 522,611 | 505,696 | 16,915 | 99,766 | 53,603 | 46,163 | 422,845 | 452,093 | −29,248 |
| 1978 | 559,620 | 458,769 | 100,851 | 103,503 | 53,016 | 50,487 | 456,117 | 405,753 | 50,364 |
| 1979 | 649,832 | 419,091 | 230,741 | 104,645 | 53,083 | 51,562 | 545,187 | 366,008 | 179,179 |
| 1980 | 736,362 | 439,571 | 296,791 | 104,928 | 53,728 | 51,200 | 631,434 | 385,843 | 245,591 |
| 1981 | 605,629 | 470,525 | 135,104 | 104,491 | 55,001 | 49,490 | 501,138 | 415,524 | 85,614 |
| 1982 | 404,019 | 493,495 | −89,476 | 82,337 | 60,227 | 22,110 | 321,682 | 433,268 | −111,586 |
| 1983 | 354,496 | 487,268 | −132,772 | 81,244 | 62,355 | 18,889 | 273,252 | 424,913 | −151,661 |
| 1984 | 410,387 | 604,832 | −194,445 | 79,247 | 59,764 | 19,483 | 331,140 | 545,068 | −213,928 |
| 1985 | 480,872 | 425,313 | 55,559 | 82,653 | 58,607 | 24,046 | 398,219 | 366,706 | 31,513 |
| 1986 | 567,215 | 407,139 | 160,076 | 88,867 | 59,350 | 29,517 | 478,348 | 347,789 | 130,559 |
| 1987 | 591,765 | 398,518 | 193,247 | 119,429 | 64,534 | 54,895 | 472,336 | 333,984 | 138,352 |
| 1988 | 860,578 | 419,439 | 441,139 | 213,044 | 60,498 | 152,546 | 647,534 | 358,941 | 288,593 |
| 1989 | 1,133,794 | 539,832 | 593,962 | 366,849 | 101,750 | 265,099 | 766,945 | 438,082 | 328,863 |
| 1990 | 1,256,250 | 574,378 | 681,872 | 420,548 | 108,908 | 311,640 | 835,702 | 465,470 | 370,232 |
| 1991 | 1,198,978 | 596,455 | 602,523 | 273,633 | 98,915 | 174,718 | 925,345 | 497,540 | 427,805 |
| 1992 | 1,502,198 | 720,127 | 782,071 | 290,850 | 105,171 | 185,679 | 1,211,348 | 614,956 | 596,392 |
| 1993 | 1,277,408 | 815,312 | 462,096 | 287,561 | 104,653 | 182,908 | 989,847 | 710,659 | 279,188 |
| 1994 | 1,082,553 | 767,555 | 314,998 | 305,037 | 138,280 | 166,757 | 777,516 | 629,275 | 148,241 |
| 1995 | 1,096,048 | 698,113 | 397,935 | 303,347 | 130,672 | 172,675 | 792,701 | 567,441 | 225,260 |
| 1996 | 959,691 | 677,494 | 282,197 | 251,737 | 118,430 | 133,307 | 707,954 | 559,064 | 148,890 |
| 1997 | 840,633 | 746,969 | 93,664 | 225,335 | 109,903 | 115,432 | 615,298 | 637,066 | −21,768 |
| 1998 | 802,456 | 755,358 | 47,098 | 196,956 | 116,403 | 80,553 | 605,500 | 638,955 | −33,455 |
| 1999 | 874,023 | 672,048 | 201,975 | 200,150 | 116,410 | 83,740 | 673,873 | 555,638 | 118,235 |
| 2000 | 841,158 | 674,038 | 167,120 | 191,909 | 111,244 | 80,665 | 649,249 | 562,794 | 86,455 |
| 2001 | 879,217 | 606,494 | 272,723 | 193,958 | 109,507 | 84,451 | 685,259 | 496,987 | 188,272 |
| 2002 | 842,543 | 623,255 | 219,288 | 184,202 | 117,683 | 66,519 | 658,341 | 505,572 | 152,769 |
| 2003 | 768,975 | 626,330 | 142,645 | 167,216 | 127,267 | 39,949 | 601,759 | 499,063 | 102,696 |
| 2004 | 780,175 | 697,632 | 82,543 | 177,993 | 150,667 | 27,326 | 602,182 | 546,965 | 55,217 |
| 2005 | 707,352 | 628,399 | 78,953 | 128,051 | 144,815 | −16,764 | 579,301 | 483,584 | 95,717 |
| 2006 | 661,855 | 639,064 | 22,791 | 103,388 | 155,290 | −51,902 | 558,467 | 483,774 | 74,693 |
| 2007 | 680,766 | 636,854 | 43,912 | 106,014 | 161,105 | −55,091 | 574,752 | 475,749 | 99,003 |
| 2008 | 682,146 | 737,889 | −55,743 | 108,331 | 174,759 | −66,428 | 573,815 | 563,130 | 10,685 |
| 2009 | 721,014 | 733,796 | −12,782 | 114,700 | 154,988 | −40,288 | 606,314 | 578,808 | 27,506 |
| 2010 | 798,282 | 670,605 | 127,677 | 114,752 | 141,000 | −26,248 | 683,530 | 529,605 | 153,925 |
| 2011 | 958,299 | 678,969 | 279,330 | 116,604 | 140,132 | −23,528 | 841,695 | 538,837 | 302,858 |
| 2012 | 1,080,936 | 711,991 | 368,945 | 115,028 | 133,232 | −18,204 | 965,908 | 578,759 | 387,149 |
| 2013 | 1,226,493 | 797,886 | 428,607 | 118,425 | 140,282 | −21,857 | 1,108,068 | 657,604 | 450,464 |
| 2014 | 1,464,724 | 914,241 | 550,483 | 122,195 | 148,636 | −26,441 | 1,342,529 | 765,605 | 576,924 |
| 2015 | 2,136,954 | 997,552 | 1,139,402 | 120,713 | 138,273 | −17,560 | 2,016,241 | 859,279 | 1,156,962 |
| 2016 | 1,865,122 | 1,365,178 | 499,944 | 146,047 | 281,411 | −135,364 | 1,719,075 | 1,083,767 | 635,308 |
| 2017 | 1,550,721 | 1,134,641 | 416,080 | 166,703 | 249,181 | −82,478 | 1,384,018 | 885,460 | 498,558 |
| 2018 | 1,585,112 | 1,185,432 | 399,680 | 201,531 | 261,851 | −60,320 | 1,383,581 | 923,581 | 460,000 |
| 2019 | 1,558,612 | 1,231,552 | 327,060 | 212,669 | 270,294 | −57,625 | 1,345,943 | 961,258 | 384,685 |
| 2020 | 1,186,702 | 966,451 | 220,251 | 191,883 | 220,239 | −28,356 | 994,819 | 746,212 | 248,607 |
| 2021 | 1,323,466 | 994,303 | 329,163 | 183,650 | 247,829 | −64,179 | 1,139,816 | 746,474 | 393,342 |
| 2022 | 2,665,772 | 1,203,683 | 1,462,089 | 184,753 | 268,167 | −83,414 | 2,481,019 | 935,516 | 1,545,503 |
| 2023 | 1,936,754 | 1,284,570 | 652,184 | 191,270 | 270,598 | −79,328 | 1,745,484 | 1,013,972 | 731,512 |
| 2024 | 1,697,192 | 1,278,425 | 418,767 | 188,982 | 276,161 | −87,179 | 1,508,210 | 1,002,264 | 505,946 |
| 2025 | 1,481,299 | 1,259,258 | 222,041 | 191,741 | 295,193 | −103,452 | 1,289,558 | 964,066 | 325,492 |
Education

Responsibility for educational oversight in Germany lies primarily with the individual federated states. Since the 1960s, a reform movement has attempted to unify secondary education into a Gesamtschule (comprehensive school); several West German states later simplified their school systems to two or three tiers. A system of apprenticeship called Duale Ausbildung ("dual education") allows pupils in vocational training to learn in a company as well as in a state-run vocational school.[104]
Optional kindergarten education is provided for all children between three and six years old, after which school attendance is compulsory for at least nine years, depending on the state. Primary education usually lasts for four years and public schools are not stratified at this stage.[104] In contrast, secondary education includes three traditional types of schools focused on different levels of academic ability: the Gymnasium enrols the most academically promising children and prepares students for university studies; the Realschule for intermediate students lasts six years; the Hauptschule prepares pupils for vocational education.[105]
In addition Germany has a comprehensive school known as the Gesamtschule. While some German schools such as the Gymnasium and the Realschule have rather strict entrance requirements, the Gesamtschule does not have such requirements. They offer college preparatory classes for the students who are doing well, general education classes for average students, and remedial courses for those who aren't doing that well. In most cases students attending a Gesamtschule may graduate with the Hauptschulabschluss, the Realschulabschluss or the Abitur depending on how well they did in school. The percentage of students attending a Gesamtschule varies by Bundesland. In 2007 the State of Brandenburg more than 50% of all students attended a Gesamtschule,[106] while in the State of Bavaria less than 1% did.
The general entrance requirement for university is Abitur, a qualification normally based on continuous assessment during the last few years at school and final examinations; however there are a number of exceptions, and precise requirements vary, depending on the state, the university and the subject. Germany's universities are recognised internationally; in the Academic Ranking of World Universities (ARWU) for 2008, six of the top 100 universities in the world are in Germany, and 18 of the top 200.[107] Nearly all German universities are public institutions, tuition fees in the range of €500 were introduced in some states after 2006, but quickly abolished again until 2014.
| Year | Hauptschulabschluss | Realschulabschluss | Abitur |
|---|---|---|---|
| 1970 | |||
| 1982 | |||
| 1991 | |||
| 2000 |
Literacy
Over 99% of those of age 15 and above are estimated to be able to read and write. However, a growing number of inhabitants are functionally illiterate. The young are much more likely to be functionally illiterate than the old. According to a study done by the University of Bremen in cooperation with the "Bundesverband Alphabetisierung e.V.", 10% of youngsters living in Germany are functionally illiterate and one quarter are able to understand only basic level texts.[109] Illiteracy rates of youngsters vary by ethnic group and parents' socioeconomic class.
Health
The life expectancy in Germany is 81.1 years (78.7 years males, 83.6 years females, 2020 est.).[110]As of 2024, the principal cause of death was cardiovascular disease, at 33.7%, followed by malignant tumours, at 23.7%.[111]As of 2008, about 82,000 Germans had been infected with HIV/AIDS and 26,000 had died from the disease (cumulatively, since 1982).[112] According to a 2005 survey, 27% of German adults are smokers.[112] A 2009 study shows Germany is near the median in terms of overweight and obese people in Europe.[113]
Religion

Roman Catholic majority
Christian majority, Catholic plurality
Christian majority, EKD plurality
Christians less than 50% of population, majority of Christians belong to EKD
The national constitutions of 1919 and 1949 guarantee freedom of faith and religion; earlier, these freedoms were mentioned only in state constitutions. The modern constitution of 1949 also states that no one may be discriminated against due to their faith or religious opinions. A state church does not exist in Germany (see Freedom of religion in Germany).[114]
According to a 1990s poll by Der Spiegel, 45% of Germans believe in God, and a quarter in Jesus Christ.[115] According to the Eurobarometer Poll 2010, 44% of German citizens responded that "they believe there is a God", 25% responded that "they believe there is some sort of spirit or life force" and 27% responded that "they don't believe there is any sort of spirit, God or life force". 4% gave no response.[116]
Christianity is the largest religion in Germany, comprising roughly half of the country's population.[117][118][119]
Smaller religious groups (less than 1%) include Judaism, Buddhism and Hinduism.[120][117]
The two largest churches, the Roman Catholic Church and the Protestant Church in Germany (EKD), have lost significant number of adherents. In 2023 the Catholic Church accounted for 24%[117][118][121] and the Evangelical Church for 21.9%[117][118][122] of the population. Orthodox Church has 1.5% and other Christian churches and groups summed up to 1% of the population.[117][120] Since the reunification of Germany, the number of non-religious people has grown and an estimated 46.2% of the country's population are not affiliated with any church or religion.[117][118][120][119]
The other religions make up to less than 1% of the population.[120]Buddhism has around 200,000 adherents (0.2%), Judaism has around 200,000 adherents (0.2%), Hinduism 90,000 (0.1%), Sikhism 75,000 (0.1%) and Yazidis religion (45,000–60,000).[123] All other religious communities in Germany have fewer than 50,000 (<0.1%) adherents.
Protestantism is concentrated in the north and east and Roman Catholicism is concentrated in the south and west. According to the last nationwide census, Protestantism is more widespread among the population with German citizenship; there are slightly more Catholics total because of the Catholic immigrant population (including such groups as Poles and Italians).[125] The former Pope, Benedict XVI, was born in Bavaria. Non-religious people, including atheists and agnostics are especially numerous in the former East Germany and major metropolitan areas.[126]
Of the roughly 4 million Muslims, most are Sunnis and Alevites from Turkey, but there are a small number of Shi'ites and other denominations.[127][128] 1.5% of the country's overall population declare themselves Orthodox Christians,[117] with Serbs, Greeks, Romanians, Ukrainians and Russians being the most numerous.[129] Germany has Europe's third-largest Jewish population (after France and the United Kingdom).[130] In 2004, twice as many Jews from former Soviet republics settled in Germany as in Israel, bringing the total Jewish population to more than 200,000, compared to 30,000 prior to German reunification. Large cities with significant Jewish populations include Berlin, Frankfurt and Munich.[131] Around 250,000 active Buddhists live in Germany; 50% of them are Asian immigrants.[132]
2011 Census
Religion (2011 German Census)
- Catholic Church (30.8%)
- EKD (30.3%)
- Other, atheist or unspecified[133] (38.9%)
Census results were as follows:
- Roman Catholic Church: 24,740,380 or 30.8% of the German population;
- Protestant Church: 24,328,100 or 30.3% of the German population;
- Other, atheist or not specified (including Protestants outside EKD): 31,151,210 or 38.9% of the German population.[125]
Languages
German is the only official and most widely spoken language. Standard German is understood throughout the country.
Microcensus data
Since 2017, the Federal Statistical Office of Germany included a new question regarding the language spoken at home in the micro-census, a large sample survey that yearly covers approximately 1% of the German population living in private households.[134] In recent years, there has been a noticeable decline in the number and proportion of people in Germany who speak only German at home, accompanied by a corresponding increase in the use of other languages or multilingual households. This can be attributed to the increasing size of the Germans with a migration background and the decreasing size of the population without a migration background.[135]
| Year | Total population | Only German | Mostly German | Mostly another language | ||||
|---|---|---|---|---|---|---|---|---|
| Absolute | % | Absolute | % | Absolute | % | Absolute | % | |
| 2021 | 81,035,000 | 100.00 | 65,420,000 | 80.73 | 3,775,000 | 4.66 | 11,840,000 | 14.61 |
| 2022 | 81,852,000 | 100.00 | 64,984,000 | 79.39 | 4,026,000 | 4.92 | 12,842,000 | 15.69 |
| 2023 | 82,472,000 | 100.00 | 64,000,000 | 77.60 | 3,635,000 | 4.41 | 14,837,000 | 17.99 |
| 2024 | 82,769,000 | 100.00 | 63,554,000 | 76.78 | 3,776,000 | 4.56 | 15,439,000 | 18.65 |
The following table provides the results of the 2024 microcensus, using 2022 census data as the basis for the projection, regarding the languages spoken at home.[136] After German (81.34%), the most spoken languages were Turkish (2.61%), Russian (2.27%), Arabic (1.70%), English (1.26%) and Polish (1.19%), each with more than one million people speaking them in their homes.
| Language | Absolute number | Percentage |
|---|---|---|
| Albanian | 601,000 | |
| Arabic | 1,407,000 | |
| Bosnian | 246,000 | |
| Bulgarian | 227,000 | |
| Chinese | 159,000 | |
| Danish | 22,000 | |
| English | 1,047,000 | |
| French | 194,000 | |
| Greek | 308,000 | |
| Hindi | 87,000 | |
| Italian | 481,000 | |
| Croatian | 377,000 | |
| Kurdish | 575,000 | |
| Macedonian | 90,000 | |
| Dutch | 90,000 | |
| Pashto | 58,000 | |
| Persian | 428,000 | |
| Polish | 983,000 | |
| Portuguese | 182,000 | |
| Romanian | 750,000 | |
| Russian | 1,877,000 | |
| Serbian | 262,000 | |
| Spanish | 354,000 | |
| Turkish | 2,162,000 | |
| Ukrainian | 711,000 | |
| Hungarian | 199,000 | |
| Urdu | 104,000 | |
| Tamil | 60,000 | |
| Vietnamese | 159,000 | |
| Overall | ||
| Total population | 82,769,000 | |
| Only German | 63,554,000 | |
| Mostly German | 3,776,000 | |
| Mostly another language | 15,439,000 | |
| Another European language | 243,000 | |
| Another African language | 260,000 | |
| Another Asian language | 442,000 | |
| Another language | 352,000 | |
Minority languages

Danish, Low German, Low Rhenish, the Sorbian languages (Lower Sorbian and Upper Sorbian), and the two Frisian languages, Saterfrisian and North Frisian, are officially recognized and protected as minority languages by the European Charter for Regional or Minority Languages in their respective regions. With speakers of Romany living in all parts of Germany, the federal government has promised to take action to protect the language. Until now, only Hesse has followed Berlin's announcement, and agreed on implementing concrete measures to support Romany speakers.
Germany is a strong supporter of the Charter, as evidenced by things like the 2022 report from the Secretary General of the Council of Europe specifically naming Germany as an example of how to incorporate minority languages in State media.[137][138] Still, Germany—like many other signatories of the Charter—has room for improvement in its implementation of the Charter.[139]
| Language | States |
|---|---|
| Danish | Schleswig-Holstein |
| North Frisian | Schleswig-Holstein |
| Saterland Frisian | Lower Saxony |
| Low German | Brandenburg, Bremen, Hamburg, Mecklenburg-Vorpommern, Lower Saxony, Saxony-Anhalt, Schleswig-Holstein, North Rhine-Westphalia |
| Low Rhenish | North Rhine-Westphalia |
| Upper Sorbian | Saxony |
| Lower Sorbian | Brandenburg |
| Romany | Hessede facto, de jure in all states (see text) |
High German dialects

German dialects – some quite distinct from the standard language – are used in everyday speech, especially in rural regions. Many dialects, for example the Upper German varieties, are to some degree cultivated as symbols of regional identity and have their own literature, theaters and some TV programming. While speaking a dialect outside its native region might be frowned upon, in their native regions some dialects can be spoken by all social classes. Nevertheless, partly due to the prevalence of Standard German in media, the use of dialects has declined over the past century, especially in the younger population.
The social status of different German dialects can vary greatly. The Alemannic and Bavarian dialects of the south are positively valued by their speakers and can be used in almost all social circumstances. The Saxonian and Thuringian dialects have less prestige and are subject to derision. While Bavarian and Alemannic have kept much of their distinctiveness, the Middle German dialects, which are closer to Standard German, have lost some of their distinctive lexical and grammatical features and tend to be only pronunciation variants of Standard German.
Low Saxon dialects
Although Low Saxon is officially recognized as a language on its own, little official action has been taken to foster the language. Historically one third of Germany's territory and population was Low Saxon speaking. No data has ever been collected on the actual number of speakers, but today the number of speakers is around 5 million. Despite this relatively high number of speakers there is very little coverage in the media (mostly on NDR TV, no regular programming) and very little education in or on the language. The language is not fixed as part of the school curriculum, and Low Saxon is used as a medium of instruction in only one school in the whole of Germany (as a "model project" in primary school alongside education in Standard German). As a consequence the younger generation refused to adopt the native language of their parents. Language prevalence dropped from more than 90% (depending on the exact region) in the 1930s to less than 5% today. This accounts for a massive intergenerational gap in language use. Older people regularly use the language and take private initiatives to maintain the language, but the lack of innovative potential of the younger generation hinders language maintenance. The language also has its own literature (around 150 published books every year) and there are many theatres (mostly amateur dramatics, but some professional ones, such as Ohnsorg-Theater).
Use of Low Saxon is mainly restricted to use among acquaintances, such as family members, neighbours and friends. A meeting of a village council can be held almost completely in Low Saxon if all participants know each other (as long as written protocols are written in Standard German), but a single foreigner can make the whole meeting switch to Standard German.
The Low Saxon dialects differ in their status too. There is a north–south gradient in language maintenance. The southern dialects of Westfalian, Eastfalian and Brandenburgish have had much stronger speaker losses than the northern coastal dialects of Northern Low Saxon. While Eastfalian has lost speakers to Standard German, Westfalian has lost speakers both to Standard German and to the Standard German-based regiolect of the Rhine-Ruhr area. Brandenburgish speakers mostly switched to the Standard German-based regiolect of Berlin. Brandenburgish has been almost completely replaced by the Berlin regiolect. Northern Low Saxon speakers switched mostly to pure Standard German.
Foreign languages
English is the most common foreign language and is almost universally taught at the secondary level; it is also taught at elementary level in some states. Other commonly-taught languages are French, Italian, Spanish and Russian. Dutch is taught in states bordering the Netherlands, and Polish in the eastern states bordering Poland.[140]Latin and Ancient Greek are part of the classical education syllabus offered in many secondary schools.
According to a 2004 survey, two-thirds of Germany's citizens have at least basic knowledge of English. About 20% consider themselves to be competent speakers of French, followed by speakers of Russian (7%), Italian (6.1%), and Spanish (5.6%). The relatively high number of Russian speakers is a result of immigration from the former Soviet Union to Germany for almost 10 consecutive years, plus its having been learned in school by many older former East Germans as compulsory first foreign language.
See also
Notes
- ↑In fertility rates, 2.1 and above is a stable population and have been marked blue, 2 and below leads to an aging population and a reducing population.
References
- 12"Bevölkerungsstand". Archived from the original on 23 August 2019. Retrieved 7 February 2022.
- 12"Lebendgeborene und Gestorbene". Retrieved 13 September 2019.
- ↑"Lebenserwartung in Deutschland nahezu unverändert". Retrieved 9 July 2021.
- ↑"Net migration rate Comparison - The World Factbook". www.cia.gov. Archived from the original on 4 January 2021. Retrieved 17 July 2025.
- ↑"International Migrant Stock". United Nations Population Division. Retrieved 12 June 2026.
- 1234567891011121314151617181920212223242526272829303132333435363738"Population with a migrant background by selected countries of birth". Destatis. 1 May 2025. Retrieved 15 September 2025.
- ↑"Histat:Population statistics". Retrieved 31 August 2021.
- ↑"The Population History of Germany: Research Strategy and Preliminary Results"(PDF). Archived(PDF) from the original on 23 December 2010.
- ↑"Zusammengefasste Geburtenziffer nach Kalenderjahren". Retrieved 13 September 2019.
- ↑"Die Datenbank des Statistischen Bundesamtes". Retrieved 1 July 2021.
- ↑"Births and Deaths". Retrieved 1 July 2021.
- ↑"Migrant background". Retrieved 13 April 2026.
- ↑"Bund der Vertriebenen: Aktuelle Aussiedlerstatistik". www.bund-der-vertriebenen.de. Retrieved 26 May 2022.
- ↑"Russia Hopes to Lure Back Ethnic Germans". DW.
- 12"Asylum statistics". Archived from the original on 9 July 2021. Retrieved 2 July 2021.
- ↑"Important Economic Indicators". 15 January 2019.
- ↑"Sozialhilfe: Kinderarmut nimmt zu". Focus. 15 November 2007
- ↑Holger Wunderlich. Springer VS. Familienpolitik vor Ort – Strukturen, Akteure und Interaktionen auf kommunaler Ebene. p. 52
- 12"Berlin-Institut für Bevölkerung und Entwicklung: Ostdeutschland". Berlin-institut.org. Archived from the original on 13 August 2017. Retrieved 24 August 2017.
- ↑Michaela Kreyenfeld; Kryštof Zeman; Marion Burkimsher; Ina Jaschinski, "Fertility data for German-speaking countries What is the potential? Where are the pitfalls?"(PDF), Max Planck Institute for Demographic Research, archived(PDF) from the original on 2 February 2011
- 123Kulish, Nicholas (19 June 2009). "In East Germany, a Decline as Stark as a Wall". The New York Times. Retrieved 11 October 2009.
- ↑"Lack of Women in Eastern Germany Feeds Neo-Nazis". Spiegel Online. Spiegel International. 31 May 2007. Retrieved 11 October 2009.
- ↑"Zusammengefasste Geburtenziffer nach Kalenderjahren". Destatis.de. Retrieved 13 April 2018.
- ↑"East Germany overtakes West Germany: recent trends in order-specific fertility dynamics". Demogr.mpg.de. Archived from the original on 23 September 2015. Retrieved 24 August 2017.
- ↑"State & society – Births – Average number of children per woman – Federal Statistical Office (Destatis)". Destatis.de. Retrieved 13 April 2018.
- ↑Christoph Butterwegge, Michael Klundt, Matthias Zeng: Kinderarmut in Ost- und Westdeutschland. 2., erweiterte und aktualisierte Auflage. VS Verlag für Sozialwissenschaften, 2008, ISBN 978-3-531-15915-7, p. 99–100
- ↑§ 10 Abs. 5 BEEG, BGBl. I, S. 1885, 1896
- ↑Bujard, Martin (Hrsg.) (2013): Elterngeld und Elternzeit in Deutschland: Ziele, Diskurse und Wirkungen. Schwerpunktheft der Zeitschrift für Familienforschung, 25. Jg., Band 2, Leverkusen: Verlag Barbara Budrich
- ↑Bundesintitut für Bevölkerungsforschung 2012. Talsohle bei Akademikerinnen durchschritten? Kinderzahl und Kinderlosigkeit in Deutschland nach Bildungs- und Berufsgruppen. Expertise für das Bundesministerium für Familie, Senioren, Frauen und Jugend. p. 15
- ↑"Prognose: Wohlstand in Deutschland wird sinken". Handelsblatt (in German). 12 December 2019. Archived from the original on 10 September 2024. Retrieved 31 January 2020.
- ↑"Germany Population 2018", World Population Review
- ↑Fuhrmans, Vanessa (29 July 2011). "Germans Tally Their Concerns Over Census". The Wall Street Journal.
- ↑Note: Crude migration change (per 1000) is a trend analysis, an extrapolation based average population change (current year minus previous) minus natural change of the current year (see table statistics). As average population is an estimate of the population in the middle of the year and not end of the year.
- 123Max Roser (2014), "Total Fertility Rate around the world over the last centuries", Our World In Data, Gapminder Foundation, archived from the original on 7 August 2018, retrieved 7 August 2018
- ↑"Life expectancy". Our World in Data. Retrieved 23 December 2025.
- 12"Deaths, life expectancy: Life expectancy by sex and state". Federal Statistical Office of Germany. Retrieved 29 August 2024.
- ↑"Life expectancy". Our World in Data. Retrieved 28 August 2018.
- ↑"World Population Prospects – Population Division – United Nations". Archived from the original on 19 September 2016. Retrieved 15 July 2017.
- ↑"Startseite – Statistisches Bundesamt (Destatis)". destatis.de. Retrieved 23 October 2015.
- ↑"Population Statistics – Histat". Retrieved 31 August 2021.
- ↑"Zusammengefasste Geburtenziffer in Deutschland (1871–2021)". Bundesinstitut für Bevölkerungsforschung.
- ↑"Development of births". Federal Statistical Office of Germany.
- ↑"Germany". World Bank.
- ↑"World Factbook Europe: Germany", The World Factbook, 12 July 2018, archived from the original on 9 January 2021
- ↑"Fertility rate: children per woman, 1817 to 2016". Archived from the original on 11 December 2022. Retrieved 16 May 2025.
{{cite web}}: CS1 maint: bot: original URL status unknown (link) - ↑Overmans, Rüdiger (2004). Deutsche militärische Verluste im Zweiten Weltkrieg. Oldenbourg. ISBN 978-3-486-20028-7.
- ↑"Bevölkerung nach Nationalität und Geschlecht (Quartalszahlen)". Statistisches Bundesamt (in German). Retrieved 15 April 2025.
- ↑"Bevölkerung nach Nationalität und Geschlecht (Quartalszahlen)". DESTATIS – Statistisches Bundesamt (in German). Statistisches Bundesamt. 14 April 2025. Retrieved 14 April 2025.
- ↑"Lebendgeborene nach Geschlecht". DESTATIS – Statistisches Bundesamt (in German). Statistisches Bundesamt. 14 April 2025. Retrieved 14 April 2025.
- ↑"Lebendgeborene, Gestorbene, Geburten-/Sterbeüberschuss (ab 1950)". DESTATIS – Statistisches Bundesamt (in German). Statistisches Bundesamt. 14 April 2025. Retrieved 14 April 2025.
- ↑"Deaths, deaths per 1000 inhabitants: Germany, years". www-genesis.destatis.de. 19 September 2025. Retrieved 19 September 2025.
- ↑"Zusammengefasste Geburtenziffer nach Kalenderjahren". DESTATIS – Statistisches Bundesam (in German). Statistisches Bundesamt. 14 April 2025. Retrieved 14 April 2025.
- ↑"Bevölkerung nach Nationalität und Geschlecht (Quartalszahlen)". DESTATIS – Statistisches Bundesamt (in German). Statistisches Bundesamt. 14 April 2025. Retrieved 14 April 2025.
- ↑"Live births: Germany, months, sex". 23 September 2021.
- ↑"Deaths: Germany, months, sex". 23 September 2021.
- ↑"Lebendgeborene nach Monaten – vorläufige Ergebnisse". Statistisches Bundesamt.
- ↑"Fertility indicators by NUTS 3 region". ec.europa.eu. Retrieved 27 September 2025.
- ↑"Presse: Rückgang der Geburtenziffer schwächte sich 2024 deutlich ab". Statistisches Bundesamt. 17 July 2025.
- 12"UNSD — Demographic and Social Statistics". United Nations Statistics Division. Retrieved 10 May 2023.
- ↑"Unmarried births". Retrieved 1 July 2021.
- ↑Handelsblatt (12 August 2011): "Familienplanung: Uneheliche Babys im Vormarsch"
- ↑"Children born outside of marriage Germany 1950–2021". Statista. Retrieved 26 June 2023.
- ↑Statistisches Bundesamt. Mikrozensus 2008. Neue Daten zur Kinderlosigkeit in Deutschland. p. 27ff
- 12Statistisches Bundesamt. Mikrozensus 2008. Neue Daten zur Kinderlosigkeit in Deutschland. p.29
- ↑Bundesintitut für Bevölkerungsforschung 2012. Talsohle bei Akademikerinnen durchschritten? Kinderzahl und Kinderlosigkeit in Deutschland nach Bildungs- und Berufsgruppen. Expertise für das Bundesministerium für Familie, Senioren, Frauen und Jugend. p. 14
- ↑Michael Blume; Carsten Ramsel; Sven Graupner (June 2006). "Religiosität als demografischer Faktor – Ein unterschätzter Zusammenhang?"(PDF). Marburg Journal of Religion. 11. Archived(PDF) from the original on 25 April 2012.
- ↑Michael Blume (2008) Homo religiosus, Gehirn und Geist 04/2009. S. 32–41.
- ↑Nicole Auferkorte-Michaelis, Sigrid Metz-Göckel, Jutta Wergen, Annette Klein. 2005: "Junge Elternschaft und Wissenschaftskarriere – Wie kinderfreundlich sind Deutschlands Universitäten". Hochschuldidaktisches Zentrum HDZ
- 12"Homelessness in Germany on the rise". DW.COM. 11 November 2019. Archived from the original on 31 January 2020. Retrieved 31 January 2020.
- ↑"Statistics of homeless people accommodated". Statistisches Bundesamt. Archived from the original on 10 January 2024. Retrieved 10 January 2024.
- ↑"Germany: 150 percent rise in number of homeless since 2014". DW.COM. 14 November 2017. Archived from the original on 17 February 2020. Retrieved 17 February 2020.
- ↑"OHCHR | Home". ohchr.org. Archived from the original on 5 May 2021. Retrieved 31 January 2020.
- ↑Shendruk, Amanda (8 July 2021). "Are you even trying to stop racism if you don't collect data on race?". Quartz. Retrieved 4 July 2022.
- 12"Publikation – STATmagazin – Population – Families with a migrant background: traditional values count – Federal Statistical Office (Destatis)". destatis.de. 27 August 2012. Retrieved 23 October 2015.
- 1234567"Bevölkerung mit Migrationshintergrund – Ergebnisse des Mikrozensus 2019 –"(PDF). destatis.de (in German). 28 July 2020. p. 68.
- ↑Statistisches Bundesamt Deutschland: "Leichter Anstieg der Bevölkerung mit Migrationshintergrund". Pressemitteilung Nr.105 vom 11 March 2008
- ↑"Statistischer Bericht – Mikrozensus – Bevölkerung nach Migrationshintergrund – Erstergebnisse 2022 (The statements are based on statistics listed in excel-Table 12211-03.)". Destatis. Statistisches Bundesamt. 20 April 2023. Retrieved 6 November 2023.
- ↑This number represents the number of people without "immigrant background", meaning people with two parents of mostly or full German ancestry. It does not represent the number of people who view themselves as German. This number does not include people with a German forebear, who came to modern Germany after 1955 (including Aussiedler and Spätaussiedler) and descendants of that person.
- ↑"2005". Fachserie / 1 / 2 / 2: Ergebnisse des Mikrozensus (in German). 23 August 2017.
- 12345"Bevölkerung und Erwerbstätigkeit; Bevölkerung mit Migrationshintergrund – Ergebnisse des Mikrozensus 2022 –". destatis.de (in German).
- ↑"2011". Fachserie / 1 / 2 / 2: Ergebnisse des Mikrozensus (in German). 13 March 2017.
- ↑"2016". Fachserie / 1 / 2 / 2: Ergebnisse des Mikrozensus (in German). 31 August 2017.
- ↑"World War I: Restoring Poland | Library of Congress Blog". 25 January 2017.
- ↑Lilo Locher (22 February 2002). "Determining the shape of a migration wave"(PDF). Archived from the original(PDF) on 21 March 2004.
- ↑J. Otto Pohl. "The Deportation and Destruction of the German Minority in the USSR"(PDF). Odessa3.org. Archived(PDF) from the original on 24 September 2015. Retrieved 24 August 2017.
- ↑"Jewish Population of the World – Jewish Virtual Library". jewishvirtuallibrary.org. Retrieved 23 October 2015.
- ↑"Citizenship groups". Retrieved 1 July 2021.
- 12"All foreign citizenships". Retrieved 2 July 2021.
- ↑"Germany: Immigration in Transition". migrationpolicy.org. July 2004. Retrieved 23 October 2015.
- ↑Stephan Lanz: "Berlin aufgemischt — abendländisch — multikulturell — kosmopolitisch? Die politische Konstruktion einer Einwanderungsstadt". 2007. Bielefeld: transcript Verlag; p. 113
- ↑Karin Weiss: "Die Einbindung ehemaliger vietnamesischer Vertragsarbeiterinnen und Vertragsarbeiter in Strukturen der Selbstorganisation", In: Almut Zwengel: "Die "Gastarbeiter der DDR — politischer Kontext und Lebenswelt". Studien zur DDR Gesellschaft; p. 264
- ↑"Immigration by Country 2024".
- 12"International Migration Report 2017 – Highlights"(PDF). UN Department of Economic and Social Affairs. Archived(PDF) from the original on 23 December 2017. Retrieved 9 June 2016.
- ↑"Pressemitteilungen – Bevölkerung mit Migrationshintergrund um 8,5 % gestiegen – Statistisches Bundesamt (Destatis)". Destatis.de. Retrieved 24 August 2017.
- ↑"Federal Statistical Office Germany – GENESIS-Online". 7 February 2025.
- ↑"Bevölkerungsstand". Archived from the original on 23 August 2019. Retrieved 8 November 2020.
- ↑The individual denomination is either Land [state], Freistaat [free state] or Freie (und) Hansestadt [free (and) Hanseatic city]."The Federal States". Bundesrat.de. Bundesrat of Germany. Archived from the original on 10 September 2013. Retrieved 17 July 2011."Amtliche Bezeichnung der Bundesländer"[Official denomination of federated states]. Auswaertiges-amt.de (in German). Federal Foreign Office. Archived from the original on 21 October 2011. Retrieved 22 October 2011.
- ↑"Bevölkerungsstand Länder". Retrieved 12 August 2022.
- ↑Website of the City of Leipzig: https://www.leipzig.de/fileadmin/mediendatenbank/leipzig-de/Stadt/02.1_Dez1_Allgemeine_Verwaltung/12_Statistik_und_Wahlen/Statistik/Leipzig_fb_Migranten.pdf
- ↑"See page 21 of this report"(PDF). Bamf.de. Archived from the original(PDF) on 25 October 2017. Retrieved 24 August 2017.
- ↑"2015: Mehr Asylanträge in Deutschland als jemals zuvor". Bundesministerium des Innern. Archived from the original on 24 August 2017. Retrieved 24 August 2017.
- ↑"Germany: Immigrants made up over 18% of 2022 population". Deutsche Welle.
- ↑"Ukrainian refugees by country 2023". Statista.
- 12"Country profile: Germany"(PDF). Library of Congress. April 2008. Retrieved 28 March 2011.
- ↑"The Educational System in Germany". Cuesta College. 31 August 2002. Archived from the original on 13 May 2011. Retrieved 16 May 2011.
- ↑Prof Dr. Valentin Merkelbach. "Gesamtschulen und Grundschulen sind das Beste in unserem Schulsystem". Bildungsklick.de. Retrieved 24 August 2017.
- ↑"Top 100 World Universities". Academic Ranking of World Universities. Archived from the original on 22 August 2008. Retrieved 28 March 2011.
- ↑Frietsch, Rainer (November 2003). ""Intensivierung" von Bildungsabschlüssen zwischen 1970–2000"(PDF). Studien zum Deutschen Innovationssystem (5–2004). ISSN 1613-4338. Archived from the original(PDF) on 7 October 2007. Retrieved 21 November 2009.
- ↑Teachers News: "Funktionaler Analphabetismus"
- ↑"The World Factbook". 30 May 2023. Archived from the original on 9 January 2021.
- ↑"Anzahl der Gestorbenen nach Kapiteln der ICD-10 und Geschlecht für das Jahr 2024" (in German). Destatis.de. Retrieved 14 April 2026.
- 12"Country Profile Germany"(PDF). Library of CongressFederal Research Division. April 2008. Retrieved 7 May 2011. This article may incorporate text from this source, which is in the public domain.
- ↑"Statistics Explained". europa.eu. Retrieved 23 October 2015.
- ↑Basic Law Art. 140
- ↑"By Location". Adherents.com. Archived from the original on 18 August 2000. Retrieved 23 January 2016.
- ↑"Special Eurobarometer, biotechnology, page 204"(PDF). Fieldwork: Jan–Feb 2010. Archived(PDF) from the original on 15 December 2010. Retrieved 10 September 2017.
- 1234567"Religionszugehörigkeiten in Deutschland 2020" (in German). Forschungruppe Weltanschauungen in Deutschland. 23 September 2021. Retrieved 3 January 2022.
- 1234"Zahlen und Fakten zum kirchlichen Leben"(PDF) (in German). Evangelische Kirche in Deutschland. Archived(PDF) from the original on 14 July 2021. Retrieved 3 January 2022.
- 12"Religionszugehörigkeiten 2023". fowid.de (in German). 28 August 2024. Retrieved 27 September 2024.
- 1234REMID Data of "Religionswissenschaftlicher Medien- und Informationsdienst"Archived 28 May 2014 at the Wayback Machine retrieved 16 January 2015
- ↑Official church statistics of the Roman Catholic Church in Germany 2015Archived 23 August 2017 at the Wayback Machine, Dbk.de, retrieved 25 January 2016
- ↑Official press release of the Protestant Church in Germany on 2014 membership data, Ekd.de, retrieved 25. January 2016
- ↑"Die Yeziden in Deutschland – Religion und Leben". 23 February 2014. Archived from the original on 23 February 2014. Retrieved 24 August 2017.
- ↑"Religionszugehörigkeiten 2023". 28 August 2024.
- 12"Zensus 2011 : Bevölkerung und Haushalte Bundesrepublik Deutschland". Ergebnisse.zensus2011.de. 9 May 2011. Archived from the original on 25 May 2017. Retrieved 24 August 2017.
- ↑(in German)Religionen in Deutschland: MitgliederzahlenArchived 28 May 2014 at the Wayback Machine Religionswissenschaftlicher Medien- und Informationsdienst; 31 October 2009. Retrieved 19 November 2009.
- ↑"Chapter 2: Wie viele Muslime leben in Deutschland?"[How many Muslims live in Germany?]. Muslimisches Leben in Deutschland[Muslim Life in Germany] (in German). Nuremberg: Federal Office for Migration and Refugees (German: Bundesamt für Migration und Flüchtlinge), an agency of the Federal Ministry of the Interior (Germany). June 2009. p. 80. ISBN 978-3-9812115-1-1. Archived from the original(PDF) on 30 April 2011. Retrieved 9 September 2010.
Demnach leben in Deutschland zwischen 3,8 und4,3 Millionen Muslime [. . .] beträgt der Anteil der Muslime an der Gesamtbevölkerungzwischen 4,6 und 5,2 Prozent. Rund 45 Prozent der in Deutschland lebenden Muslime sind deutsche Staatsangehörige, rund 55 Prozent haben eine ausländische Staatsangehörigkeit.
- ↑"Chapter 2: Wie viele Muslime leben in Deutschland?"[How many Muslims live in Germany?]. Muslimisches Leben in Deutschland[Muslim Life in Germany] (in German). Nuremberg: Federal Office for Migration and Refugees (German: Bundesamt für Migration und Flüchtlinge), an agency of the Federal Ministry of the Interior (Germany). June 2009. p. 97. ISBN 978-3-9812115-1-1. Archived from the original(PDF) on 30 April 2011. Retrieved 9 September 2010.
Der Anteil der Sunniten unter den in den Haushalten lebenden Muslimen beträgt 74 Prozent
- ↑"EKD-Statistik: Christen in Deutschland 2007" (in German). Evangelische Kirche in Deutschland. Archived from the original on 30 April 2011. Retrieved 13 February 2010.
- ↑Blake, Mariah. In Nazi cradle, Germany marks Jewish renaissanceThe Christian Science Monitor. 10 November 2006. Retrieved 30 November 2006.
- ↑The Jewish Community of Germany European Jewish Congress. Retrieved 30 November 2006.
- ↑(in German)Die Zeit 12/07, page 13
- ↑Including Protestants outside EKD.
- ↑Adler, Astrid (4 September 2018). Germany's micro census of 2017: The return of the language question (Report). Institut für Deutsche Sprache.
- 12"Bevölkerung mit Migrationshintergrund". Statistisches Bundesamt (in German). Retrieved 20 May 2025.
- 12"Statistischer Bericht – Mikrozensus – Bevölkerung nach Migrationshintergrund – Erstergebnisse 2024"[Statistical report – Microcensus – Population by migration background – First results 2024]. Statistisches Bundesamt. Archived from the original on 20 May 2025.
- ↑"Application of the European Charter for Regional or Minority Languages (2021–2022): Report by the Secretary General of the Council of Europe to the Parliamentary Assembly". Parliamentary Assembly. 2022. 3.2 (20). Retrieved 14 November 2023.
- ↑ "يحتفل البرلمان الألماني (البوندستاغ) بمرور 25 عامًا على الميثاق الأوروبي للغات الإقليمية أو لغات الأقليات" . Fuen.org/ . تاريخ الاطلاع: 15 نوفمبر 2023 .
- ↑ «التوصية CM/RecChL(2022)5 للجنة الوزراء إلى الدول الأعضاء بشأن تطبيق ألمانيا للميثاق الأوروبي للغات الإقليمية أو لغات الأقليات» . search.coe.int . 2022. تاريخ الاطلاع: 15 نوفمبر 2023 .
- ↑ "معظم الطلاب الأوروبيين يتعلمون اللغة الإنجليزية في المدرسة" . 9 أبريل 2020.
روابط خارجية
- الصفحة الرئيسية للمكتب الاتحادي للإحصاء في ألمانيا (باللغة الإنجليزية)
- البيانات الديموغرافية الألمانية في قاعدة البيانات الإلكترونية HISTAT (باللغة الألمانية؛ التسجيل مطلوب)
- ملف "مجتمع الشيخوخة" لمعهد غوته
- الملف الديموغرافي لألمانيا: متحدون في التراجع - أليانز نوليدج
فئة :
- التركيبة السكانية لألمانيا