
اقتصاد الولايات المتحدة
تتمتع الولايات المتحدة باقتصاد سوقي متطور ومتنوع للغاية . [ 38 ] [ 39 ] وهي أكبر اقتصاد في العالم من حيث الناتج المحلي الإجمالي الاسمي ، إذ تُساهم بنسبة 26% من الناتج الاقتصادي العالمي. [ 40 ] [ 41 ] وتحتل المرتبة الثانية من حيث تعادل القوة الشرائية . وعلى أساس نصيب الفرد، تحتل الولايات المتحدة المرتبة التاسعة من حيث نصيب الفرد من الناتج المحلي الإجمالي الاسمي ، والمرتبة العاشرة من حيث نصيب الفرد من الناتج المحلي الإجمالي وفقًا لتعادل القوة الشرائية . [ 6 ] [ 42 ] ويُعد الدولار الأمريكي العملة الاحتياطية الرئيسية في العالم، ويُستخدم على نطاق واسع دوليًا ، كما يُستخدم كمعيار مرجعي للبترودولار واليورودولار . [ 43 ] ومنذ نهاية الحرب العالمية الثانية ، حقق الاقتصاد الأمريكي نموًا مطردًا نسبيًا، وانخفاضًا في معدلات البطالة والتضخم، إلى جانب تقدم سريع في التكنولوجيا . ويعتمد الاقتصاد الأمريكي على الإنتاجية العالية ، والتكنولوجيا ، والبنية التحتية المتطورة للنقل ، والموارد الطبيعية الوفيرة . [ 44 ]
تُعدّ الولايات المتحدة ثاني أكبر دولة مُصنِّعة في العالم ، حيث تُشكّل الصناعات الأمريكية خُمس الإنتاج العالمي. [ 45 ] أكبر شركاء الولايات المتحدة التجاريين هم المكسيك ، وكندا ، والصين ، واليابان ، وألمانيا . [ 46 ] تُعتبر الولايات المتحدة أكبر مُستورد وثاني أكبر مُصدِّر في العالم . [ 47 ] ولديها اتفاقيات تجارة حرة مع العديد من الدول . [ 48 ] كما تُعدّ أكبر مُنتج في العالم للبترول والغاز الطبيعي ومشتقات الدم . [ 49 ] [ 50 ] وتمتلك الولايات المتحدة أكبر سوق استهلاكية في العالم . [ 51 ] وفي النظام المصرفي الأمريكي، اعتبارًا من عام 2026، احتفظت البنوك التجارية بأصول بقيمة 25 تريليون دولار. [ 52 ] وتحتفظ الولايات المتحدة بسوق ضخمة لسندات الخزانة الأمريكية ، وتضم أكبر احتياطيات من الذهب في العالم . [ 53 ] كما أنها موطن لـ 139 شركة من بين أكبر 500 شركة على مستوى العالم . [ 54 ]
Americans have the sixth highest average household and employee income among OECD (Organisation for Economic Co-operation and Development) member states.[55] In 2026, they had the highest median household income among OECD countries,[56] with one of the world's highest income inequalities among developed countries.[57][58] The U.S. has the world's highest number of billionaires, with total wealth of $5.7 trillion.[59] The U.S. has a highly flexible labor market and job security is relatively low.[60][61] The nation's labor market has attracted immigrants from all over the world and its net migration rate is among the highest in the world.[62] The U.S. has a highly efficient social security system; social expenditure stood at roughly 30% of GDP.[63][64]
The New York Stock Exchange and Nasdaq are the world's largest stock exchanges by market capitalization and volume of transactions.[65][66] U.S. capital markets are vast, with combined global equity and bond activity exceeding $134.7 trillion.[67] It has ranked highly in global venture capital as well as research and development funding.[68][69] The U.S. has spent around 3.46% of GDP on cutting-edge research and development across various sectors of the economy since 2023.[70] Since the 1990s, consumer spending has comprised over 60% to 70% of the U.S. economy.[71][72] The U.S. is one of the top-performing economies in studies on the ease of doing business index and global competitiveness.[73]
History
Colonial era and 18th century
بدأ التاريخ الاقتصادي للولايات المتحدة مع المستوطنات البريطانية على طول الساحل الشرقي في القرنين السابع عشر والثامن عشر. بعد عام 1700، شهدت الولايات المتحدة نموًا سكانيًا سريعًا، ونمت معها الواردات والصادرات . ساهمت أفريقيا وآسيا ، وأوروبا في أغلب الأحيان ، في تجارة المستعمرات. [ 74 ] نالت هذه المستعمرات الثلاث عشرة استقلالها عن الإمبراطورية البريطانية في أواخر القرن الثامن عشر [ 75 ] ، وسرعان ما تحولت من اقتصادات استعمارية إلى اقتصاد قائم على الزراعة . [ 76 ]
القرن التاسع عشر

خلال 180 عامًا، نمت الولايات المتحدة لتصبح اقتصادًا ضخمًا ومتكاملًا وصناعيًا ، شكل نحو خُمس الاقتصاد العالمي . وفي خضم ذلك، تجاوز نصيب الفرد من الناتج المحلي الإجمالي في الولايات المتحدة نظيره في العديد من الدول الأخرى، متجاوزًا الإمبراطورية البريطانية في الصدارة. وحافظ الاقتصاد على أجور مرتفعة، جاذبًا ملايين المهاجرين من جميع أنحاء العالم. [ 77 ] وفي عشرينيات وثلاثينيات القرن التاسع عشر، حوّل الإنتاج الضخم جزءًا كبيرًا من الاقتصاد من الحرفيين إلى المصانع. وعززت اللوائح الحكومية الجديدة براءات الاختراع.
في أوائل القرن التاسع عشر، كان أكثر من 80% من الأمريكيين يعملون في الزراعة. وتركزت معظم الصناعات التحويلية على المراحل الأولى لتحويل المواد الخام، حيث تصدرت صناعة الأخشاب والمناشر والمنسوجات والأحذية المشهد. وساهمت الموارد الطبيعية الوفيرة في التوسع الاقتصادي السريع الذي شهده القرن التاسع عشر. وسمحت وفرة الأراضي باستمرار نمو عدد المزارعين؛ إلا أن النشاط في الصناعات التحويلية والخدمات والنقل وغيرها من القطاعات نما بوتيرة أسرع بكثير، حتى أنه بحلول عام 1860، لم تتجاوز نسبة سكان الريف 50%، بعد أن كانت تتجاوز 80%. [ 78 ]
في القرن التاسع عشر، تزامنت فترات الركود الاقتصادي في كثير من الأحيان مع الأزمات المالية . فقد أعقب ذعر عام 1837 كسادٌ دام خمس سنوات، تميز بإفلاس البنوك وارتفاع معدلات البطالة إلى مستويات غير مسبوقة. [ 79 ] ونظرًا للتغيرات الكبيرة التي شهدها الاقتصاد على مر القرون، يصعب مقارنة حدة فترات الركود الحديثة بتلك التي شهدتها فترات الركود السابقة. [ 80 ] ويبدو أن فترات الركود التي أعقبت الحرب العالمية الثانية كانت أقل حدة من فترات الركود السابقة، إلا أن أسباب ذلك لا تزال غير واضحة. [ 81 ]
القرن العشرين


في مطلع القرن، فتحت الابتكارات الجديدة والتحسينات التي طرأت على الابتكارات القائمة آفاقًا جديدة لتحسين مستوى معيشة المستهلكين الأمريكيين. ونمت العديد من الشركات نموًا هائلًا مستفيدةً من وفورات الحجم وتحسين التواصل لتسيير عملياتها على مستوى البلاد. وقد أثار التركيز في هذه الصناعات مخاوف من احتكارات من شأنها أن ترفع الأسعار وتخفض الإنتاج، إلا أن العديد من هذه الشركات خفضت التكاليف بسرعة كبيرة، ما أدى إلى اتجاه نحو انخفاض الأسعار وزيادة الإنتاج في هذه الصناعات. وتقاسم العديد من العمال نجاح هذه الشركات الكبيرة، التي كانت عادةً ما تقدم أعلى الأجور في العالم. [ 82 ]
تُعدّ الولايات المتحدة أكبر اقتصاد وطني في العالم منذ حوالي عام 1890، متجاوزةً المملكة المتحدة من حيث الناتج المحلي الإجمالي عام 1872 ونصيب الفرد من الناتج المحلي الإجمالي عام 1905، بعد تعديله وفقًا لتعادل القوة الشرائية. [ 83 ] ولسنوات عديدة تلت الكساد الكبير في ثلاثينيات القرن العشرين، حين بدا خطر الركود الاقتصادي في أشدّه، عززت الحكومة الاقتصاد من خلال الإنفاق الحكومي المكثف أو خفض الضرائب لتشجيع المستهلكين على زيادة الإنفاق، ومن خلال تعزيز النمو السريع في المعروض النقدي، مما شجع بدوره على زيادة الإنفاق. وقد شهدت الأفكار حول أفضل الأدوات لتحقيق استقرار الاقتصاد تغيرات جوهرية بين ثلاثينيات وثمانينيات القرن العشرين. فمنذ عهد الصفقة الجديدة الذي بدأ عام 1933 وحتى مبادرات المجتمع العظيم في ستينيات القرن العشرين، اعتمد صانعو السياسات الوطنية بشكل أساسي على السياسة المالية للتأثير على الاقتصاد. [ 84 ]
خلال الحربين العالميتين في القرن العشرين، كان وضع الولايات المتحدة أفضل من بقية الدول المتحاربة، إذ لم تُخض أيٌّ من الحرب العالمية الأولى ، وجزءٌ ضئيلٌ نسبيًا من الحرب العالمية الثانية، على الأراضي الأمريكية، ولم تُخض أيٌّ من الحربين في أيٍّ من الولايات الثماني والأربعين المتجاورة. ومع ذلك، حتى في الولايات المتحدة، كانت الحروب تعني تضحيات. ففي ذروة الحرب العالمية الثانية، خُصِّص ما يقرب من 40% من الناتج المحلي الإجمالي الأمريكي للإنتاج الحربي. واتُخذت قراراتٌ بشأن قطاعاتٍ واسعةٍ من الاقتصاد لأغراضٍ عسكريةٍ في الغالب، ووُجِّهت جميع المدخلات ذات الصلة تقريبًا إلى المجهود الحربي. وخضعت العديد من السلع للتقنين، ورُوقِطت الأسعار والأجور، وتوقف إنتاج العديد من السلع الاستهلاكية المعمرة. وجُنِّدت قطاعاتٌ كبيرةٌ من القوى العاملة في الجيش، وتقاضت نصف أجورها؛ وأُرسِل ما يقرب من نصف هؤلاء إلى مناطق القتال. [ 85 ]
منح هذا النهج، الذي طرحه الاقتصادي البريطاني جون ماينارد كينز ، المسؤولين المنتخبين دورًا قياديًا في توجيه الاقتصاد، نظرًا لأن الإنفاق والضرائب يخضعان لسيطرة الرئيس الأمريكي والكونغرس . شهدت "طفرة المواليد" ارتفاعًا ملحوظًا في معدلات الخصوبة خلال الفترة من 1942 إلى 1957؛ ويعود ذلك إلى تأخر الزواج والإنجاب خلال سنوات الكساد، وازدهار اقتصادي كبير، وزيادة الطلب على منازل العائلات في الضواحي (بدلًا من الشقق في قلب المدن)، وتفاؤل جديد بشأن المستقبل. بلغت الطفرة ذروتها حوالي عام 1957، ثم بدأت بالتراجع. [ 86 ] أدت فترة من التضخم المرتفع، وأسعار الفائدة المرتفعة، والبطالة المرتفعة بعد عام 1973 إلى إضعاف الثقة في السياسة المالية كأداة لتنظيم وتيرة النشاط الاقتصادي بشكل عام. [ 87 ]
نما الاقتصاد الأمريكي بمعدل 3.8% في المتوسط خلال الفترة من 1946 إلى 1973، بينما ارتفع متوسط دخل الأسر الحقيقي بنسبة 74% (أو 2.1% سنوياً). [ 88 ] [ 89 ]
منذ سبعينيات القرن الماضي، بدأت عدة دول ناشئة في تقليص الفجوة الاقتصادية مع الولايات المتحدة. ويعود ذلك في معظم الحالات إلى نقل تصنيع السلع التي كانت تُصنع سابقًا في الولايات المتحدة إلى دول أخرى حيث يمكن إنتاجها بتكلفة أقل بكثير لتغطية تكاليف الشحن وتحقيق ربح أكبر. وفي حالات أخرى، تعلمت بعض الدول تدريجيًا إنتاج نفس المنتجات والخدمات التي كانت حكرًا على الولايات المتحدة وعدد قليل من الدول الأخرى. وقد تباطأ نمو الدخل الحقيقي في الولايات المتحدة. في سبعينيات وثمانينيات القرن الماضي، ساد الاعتقاد في الولايات المتحدة بأن الاقتصاد الياباني سيتفوق على نظيره الأمريكي، لكن هذا لم يحدث. [ 90 ]
القرن الحادي والعشرون

شهد الاقتصاد الأمريكي ركودًا في عام 2001 مع تعافٍ بطيء بشكل غير معتاد في سوق العمل، حيث لم يستعد عدد الوظائف مستواه الذي كان عليه في فبراير 2001 إلا في يناير 2005. [ 91 ] تزامن هذا "التعافي المتعثر" مع تضخم فقاعة الإسكان ، وربما فقاعة ديون أوسع نطاقًا، إذ ارتفعت نسبة ديون الأسر إلى الناتج المحلي الإجمالي من مستوى قياسي بلغ 70% في الربع الأول من عام 2001 إلى 99% في الربع الأول من عام 2008. كان أصحاب المنازل يقترضون بضمان منازلهم التي ارتفعت أسعارها بشكل مبالغ فيه لتمويل استهلاكهم، مما أدى إلى زيادة مستويات ديونهم مع توفير دفعة غير مستدامة للناتج المحلي الإجمالي. عندما بدأت أسعار المساكن في الانخفاض عام 2006، انخفضت قيمة الأوراق المالية المدعومة بالرهون العقارية بشكل كبير، مما تسبب في ما يُشبه انهيارًا مصرفيًا في النظام المصرفي غير الإيداعي غير الخاضع للتنظيم بشكل أساسي ، والذي تجاوز قدرة النظام المصرفي الإيداعي التقليدي الخاضع للتنظيم . واجهت العديد من شركات الرهن العقاري وغيرها من البنوك غير المصرفية (مثل بنوك الاستثمار ) أزمة متفاقمة في الفترة 2007-2008، حيث بلغت الأزمة المصرفية ذروتها في سبتمبر 2008 ، مع إفلاس بنك ليمان براذرز وعمليات إنقاذ العديد من المؤسسات المالية الأخرى. [ 92 ]
طبّقت إدارتا بوش (2001-2009) وأوباما (2009-2017) برامج إنقاذ مصرفية وتحفيزاً اقتصادياً وفقاً لنظرية كينز عبر عجز حكومي كبير، بينما أبقى الاحتياطي الفيدرالي على أسعار فائدة قريبة من الصفر. ساهمت هذه الإجراءات في انتعاش الاقتصاد، حيث سددت الأسر ديونها في الفترة 2009-2012، وهي السنوات الوحيدة منذ عام 1947 التي شهدت هذا الأمر، [ 93 ] مما شكّل عائقاً كبيراً أمام التعافي. [ 92 ] استعاد الناتج المحلي الإجمالي الحقيقي ذروته التي سجلها قبل الأزمة (أواخر عام 2007) بحلول عام 2011، [ 94 ] وصافي ثروة الأسر بحلول الربع الثاني من عام 2012، [ 95 ] ووظائف القطاع غير الزراعي بحلول مايو 2014، [ 91 ] ومعدل البطالة بحلول سبتمبر 2015. [ 96 ] واستمرت كل هذه المتغيرات في تسجيل مستويات قياسية بعد الركود الاقتصادي عقب تلك التواريخ، ليصبح التعافي الاقتصادي في الولايات المتحدة ثاني أطول تعافي مسجل في أبريل 2018. [ 97 ]
حدث الركود الكبير خلال الأزمة المالية عام 2008 ، حيث انخفض الناتج المحلي الإجمالي بنسبة 5.0% من ربيع 2008 إلى ربيع 2009. وشهدت الفترة 1957-1958 ركودًا اقتصاديًا كبيرًا آخر، حيث انخفض الناتج المحلي الإجمالي بنسبة 3.7% في أعقاب أزمة النفط عام 1973 ، مع انخفاض بنسبة 3.1% من أواخر عام 1973 إلى أوائل عام 1975، وكذلك في ركود 1981-1982، حيث انخفض الناتج المحلي الإجمالي بنسبة 2.9%. [ 98 ] [ 99 ] وشملت حالات الركود المعتدلة الأخيرة انكماش 1990-1991، حيث انخفض الإنتاج بنسبة 1.3%، وركود 2001، الذي انخفض فيه الناتج المحلي الإجمالي بنسبة 0.3%؛ واستمر انكماش 2001 ثمانية أشهر فقط. [ 99 ] من ناحية أخرى، حدثت أقوى فترات النمو وأكثرها استدامة من أوائل عام 1961 إلى منتصف عام 1969، بنسبة توسع بلغت 53% (5.1% سنويًا)، ومن منتصف عام 1991 إلى أواخر عام 2000، بنسبة 43% (3.8% سنويًا)، ومن أواخر عام 1982 إلى منتصف عام 1990، بنسبة 37% (4% سنويًا). [ 98 ]
ارتفع الدين العام، وهو مقياس للدين الوطني ، طوال القرن الحادي والعشرين. فبعد أن ارتفع من 31% عام 2000 إلى 52% عام 2009، ووصل إلى 77% من الناتج المحلي الإجمالي عام 2017، وتجاوز 120% عام 2024، احتلت الولايات المتحدة المرتبة 43 من بين 207 دول من حيث أعلى مستويات الدين. [ 100 ]
جائحة كوفيد-19
في الربعين الأولين من عام 2020، خلال فترة رئاسة دونالد ترامب ، [ 101 ] عانى الاقتصاد الأمريكي من انتكاسات كبيرة بدءًا من مارس 2020، بسبب فيروس كورونا المستجد واضطراره إلى إغلاق قطاعات رئيسية من الاقتصاد الأمريكي. [ 102 ] وبحلول مارس 2020، انخفضت صادرات الولايات المتحدة من السيارات والآلات الصناعية بشكل حاد نتيجةً للجائحة العالمية. [ 103 ] وأدت إجراءات التباعد الاجتماعي ، التي دخلت حيز التنفيذ في مارس 2020، والتي أثرت سلبًا على الطلب على السلع والخدمات، إلى انخفاض الناتج المحلي الإجمالي الأمريكي بمعدل سنوي قدره 4.8% في الربع الأول، وهو أسرع معدل انكماش في الإنتاج منذ الربع الأخير من عام 2008. [ 104 ] وانخفضت مبيعات التجزئة الأمريكية بنسبة قياسية بلغت 8.7% في مارس وحده. كما تضررت صناعة الطيران الأمريكية بشدة، حيث شهدت انخفاضًا حادًا في إيراداتها. [ 105 ] وُصِفَ الركود الناجم عن جائحة كوفيد-19 على نطاق واسع بأنه أشدّ انكماش اقتصادي عالمي منذ الكساد الكبير، وأنه "أسوأ بكثير" من الركود العظيم . [ 106 ] [ 107 ] [ 108 ] [ 109 ]

في مايو/أيار 2020، قدمت شبكة CNN تحليلاً استناداً إلى بيانات البطالة، أشار إلى أن الاقتصاد الأمريكي ربما كان في أسوأ حالاته منذ ثلاثينيات القرن الماضي. [ 111 ] وبحلول 8 مايو/أيار، بلغت نسبة البطالة في الولايات المتحدة مستوى قياسياً قدره 14.7%، مع فقدان 20.5 مليون وظيفة في أبريل/نيسان. [ 112 ] وحذر رئيس مجلس الاحتياطي الفيدرالي الأمريكي ، جيروم باول ، من أن تعافي الاقتصاد الأمريكي الكامل من ضعف النمو الاقتصادي، نتيجةً للجائحة، قد يستغرق "وقتاً طويلاً"، وأنه في المستقبل المنظور، يمكن للولايات المتحدة أن تتوقع "انخفاضاً في نمو الإنتاجية وركوداً في الدخول". [ 113 ] وبحلول 31 مايو/أيار 2020، تقدم أكثر من أربعين مليون أمريكي بطلبات للحصول على إعانات البطالة. [ 114 ]
بحلول يونيو 2020، أدى انخفاض الرحلات الجوية داخل الولايات المتحدة بسبب جائحة فيروس كورونا إلى تعليق الحكومة الأمريكية مؤقتًا لخدمات خمس عشرة شركة طيران أمريكية إلى 75 مطارًا محليًا. [ 115 ] وذكرت صحيفة نيويورك تايمز في 10 يونيو 2020 أن "عجز الميزانية الأمريكية ارتفع إلى مستوى قياسي بلغ 1.88 تريليون دولار خلال الأشهر الثمانية الأولى من هذه السنة المالية ". [ 116 ]
تعافى الاقتصاد الأمريكي من جائحة كوفيد-19 في عام 2021، محققاً نمواً بنسبة 5.7%، وهو أفضل أداء له منذ رئاسة رونالد ريغان (1981-1989). [ 117 ]
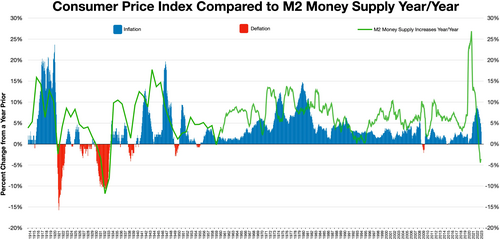
شهدت الولايات المتحدة الأمريكية ارتفاعًا تاريخيًا في التضخم خلال عامي 2021 و2022، حيث بلغ معدل التضخم في مؤشر أسعار المستهلك 9.1% في يونيو 2022 مقارنةً بيونيو 2021، مسجلًا بذلك أعلى معدل تضخم منذ 41 عامًا، وقد ألقى النقاد باللوم على الاحتياطي الفيدرالي ، من بين عوامل أخرى. [ 118 ] وبلغ معدل التضخم 4.9% في أبريل 2023، أي أعلى بنحو 3% من المعدل المستهدف للاحتياطي الفيدرالي البالغ 2%. [ 119 ]
According to a 2024 report put out by Brookings Institution, the American economy fared better following the impacts of the COVID-19 pandemic as compared to the Great Recession, also outpacing the recovery of other countries in the G10. In contrast, both Republican and Democratic leaders provided unprecedented fiscal support through relief bills in 2020 and 2021 to preserve economic activity. Researchers found the preservation of payroll and direct support to households mitigated much of the long-term impact felt following the 2008 crisis, and the supply chain disruptions were more to blame for the inflation that occurred.[120]
Post-COVID economy
By September 2025, inflation had fallen to 2.9%.[121]
The post-COVID US economy has been described as a "K-shaped" economy, or an economy in which wealthy income earners are benefiting from the stock market and rising property values, while lower income earners are having more difficulty making ends meet.[122][123]
According to a report released July 13, 2026 by the Federal Reserve Bank of Cleveland, the earnings gap between Black and Hispanic men and White men narrowed following the COVID-19 recession to its lowest point in 25 years in 2022. Black and Hispanic men also experienced a stronger employment recovery than that of White men for the same time period. The shift coincided with, but is not fully attributed to, a slight increase in the number of Black and Hispanic males that obtained both a high school diploma and Bachelors degree.[124]
On a global scale, the US recovered from Covid's economic drawbacks better than other countries. This includes outpacing the recovery of other economic groups like the G10 and Eurozone, with private consumption rising at a higher pace.[125]
Data
The following table shows the main economic indicators in 1980–2024 (with IMF staff estimates in 2025–2029). Inflation below 5% is in green.[126]
| Year | GDP(in bn. US$PPP) | GDP per capita(in US$ PPP) | GDP(in bn. US$nominal) | GDP per capita(in US$ nominal) | GDP growth(real) | Inflation rate(in percent) | Unemployment(in %) | Government debt(in % of GDP) |
|---|---|---|---|---|---|---|---|---|
| 1980 | 2,857.3 | 12,552.9 | 2,857.3 | 12,552.9 |  −0.3% −0.3% |  13.5% 13.5% | 7.2% | n/a |
| 1981 |  3,207.0 3,207.0 | 13,948.7 | 3,207.0 | 13,948.7 | 2.5% | 10.4% | 7.6% | n/a |
| 1982 | 3,343.8 | 14,405.0 | 3,343.8 | 14,405.0 | −1.8% | 6.2% | 9.7% | n/a |
| 1983 | 3,634.0 | 15,513.7 | 3,634.0 | 15,513.7 | 4.6% | 3.2% |  9.6% 9.6% | n/a |
| 1984 | 4,037.7 | 17,086.4 | 4,037.7 | 17,086.4 | 7.2% | 4.4% | 7.5% | n/a |
| 1985 | 4,339.0 | 18,199.3 | 4,339.0 | 18,199.3 | 4.2% | 3.5% | 7.2% | n/a |
| 1986 | 4,579.6 | 19,034.8 | 4,579.6 | 19,034.8 | 3.5% | 1.9% | 7.0% | n/a |
| 1987 | 4,855.3 | 20,001.0 | 4,855.3 | 20,001.0 | 3.5% | 3.6% | 6.2% | n/a |
| 1988 | 5,236.4 | 21,376.0 | 5,236.4 | 21,376.0 | 4.2% | 4.1% | 5.5% | n/a |
| 1989 | 5,641.6 | 22,814.1 | 5,641.6 | 22,814.1 | 3.7% | 4.8% | 5.3% | n/a |
| 1990 | 5963.1 | 23,848.0 | 5963.1 | 23,848.0 | 1.9% | 5.4% | 5.6% | غير متوفر |
| 1991 | 6158.1 | 24302.8 | 6158.1 | 24302.8 | -0.1% | 4.2% | 6.9% | غير متوفر |
| 1992 | 6520.3 | 25,392.9 | 6520.3 | 25,392.9 | 3.5% | 3.0% | 7.5% | غير متوفر |
| 1993 | 6858.6 | 26,364.2 | 6858.6 | 26,364.2 | 2.8% | 3.0% | 6.9% | غير متوفر |
| 1994 | 7287.3 | 27,674.0 | 7287.3 | 27,674.0 | 4.0% | 2.6% | 6.1% | غير متوفر |
| 1995 | 7,639.8 | 28,671.5 | 7,639.8 | 28,671.5 | 2.7% | 2.8% | 5.6% | غير متوفر |
| 1996 | 8,073.1 | 29,947.0 | 8,073.1 | 29,947.0 | 3.8% | 2.9% | 5.4% | غير متوفر |
| 1997 | 8,577.6 | 31,440.1 | 8,577.6 | 31,440.1 | 4.4% | 2.3% | 4.9% | غير متوفر |
| 1998 | 9,062.8 | 32,833.7 | 9,062.8 | 32,833.7 | 4.5% | 1.5% | 4.5% | غير متوفر |
| 1999 | 9,631.2 | 34,496.2 | 9,631.2 | 34,496.2 | 4.8% | 2.2% | 4.2% | غير متوفر |
| 2000 | 10,251.0 | 36,312.8 | 10,251.0 | 36,312.8 | 4.1% | 3.4% | 4.0% | غير متوفر |
| 2001 | 10,581.9 | 37,101.5 | 10,581.9 | 37,101.5 | 1.0% | 2.8% | 4.7% | 53.1% |
| 2002 | 10,929.1 | 37,945.8 | 10,929.1 | 37,945.8 | 1.7% | 1.6% | 5.8% | 55.5% |
| 2003 | 11,456.5 | 39,405.4 | 11,456.5 | 39,405.4 | 2.8% | 2.3% | 6.0% | 58.6% |
| 2004 | 12217.2 | 41,641.6 | 12217.2 | 41,641.6 | 3.9% | 2.7% | 5.5% | 66.2% |
| 2005 | 13,039.2 | 44,034.3 | 13,039.2 | 44,034.3 | 3.5% | 3.4% | 5.1% | 65.5% |
| 2006 | 13815.6 | 46,216.9 | 13815.6 | 46,216.9 | 2.8% | 3.2% | 4.6% | 64.2% |
| 2007 | 14,474.3 | 47,943.4 | 14,474.3 | 47,943.4 | 2.0% | 2.9% |  4.6% 4.6% | 64.6% |
| 2008 | 14,769.9 | 48,470.6 | 14,769.9 | 48,470.6 | 0.1% | 3.8% | 5.8% | 73.5% |
| 2009 | 14,478.1 | 47,102.4 | 14,478.1 | 47,102.4 | -2.6% | -0.3% | 9.3% | 86.7% |
| 2010 | 15,049.0 | 48,586.3 | 15,049.0 | 48,586.3 | 2.7% | 1.6% | 9.6% | 95.2% |
| 2011 | 15,599.7 | 50,008.1 | 15,599.7 | 50,008.1 | 1.6% | 3.1% | 8.9% | 99.5% |
| 2012 | 16,254.0 | 51,736.7 | 16,254.0 | 51,736.7 | 2.3% | 2.1% | 8.1% | 103.1% |
| 2013 | 16,880.6 | 53,363.9 | 16,880.6 | 53,363.9 | 2.1% | 1.5% | 7.4% | 104.3% |
| 2014 | 17,608.1 | 55,263.8 | 17,608.1 | 55,263.8 | 2.5% | 1.6% | 6.1% | 104.2% |
| 2015 | 18,295.0 | 57,006.9 | 18,295.0 | 57,006.9 | 2.9% | 0.1% | 5.2% | 104.6% |
| 2016 | 18804.9 | 58,179.6 | 18804.9 | 58,179.6 | 1.8% | 1.3% | 4.9% | 106.5% |
| 2017 | 19,612.1 | 60,292.9 | 19,612.1 | 60,292.9 | 2.5% | 2.1% | 4.4% | 105.5% |
| 2018 | 20,656.5 | 63,165.2 | 20,656.5 | 63,165.2 | 3.0% | 2.4% | 3.9% | 106.8% |
| 2019 | 21,539.9 | 65,561.3 | 21,539.9 | 65,561.3 | 2.6% | 1.8% | 3.7% | 108% |
| 2020 | 21,375.2 | 64,518.0 | 21,375.2 | 64,518.0 | -2.1% | 1.2% | 8.1% | 132% |
| 2021 | 23,725.6 | 71,365.3 | 23,725.6 | 71,365.3 | 6.2% | 4.6% | 5.3% | 124.5% |
| 2022 | 26,054.6 | 77,944.1 | 26,054.6 | 77,944.1 | 2.5% | 7.9% | 3.6% | 118.8% |
| 2023 | 27,811.5 | 82,523.2 | 27,811.5 | 82,523.2 | 2.9% | 4.1% | 3.6% | 118.9% |
| 2024 | 29,298.0 | 86,144.8 | 29,298.0 | 86,144.8 | 2.8% | 2.9% | 4% | 120.7% |
| 2025 | 30,615.7 | 89,598.8 | 30,615.7 | 89,598.8 | 2.0% | 2.7% | 4.2% | 122.4% |
| 2026 | 31,821.2 | 92,883.4 | 31,821.2 | 92,883.4 | 2.1% | 2.4% | 4.1% | 123.6% |
| 2027 | 33,019.9 | 95,960.7 | 33,019.9 | 95,960.7 | 2.1% | 2.2% | 4% | 124.9% |
| 2028 | 34,258.4 | 99,125.6 | 34,258.4 | 99,125.6 | 2.1% | 2.2% | 3.9% | 125.9% |
| 2029 | 35,513.8 | 102,275.8 | 35,513.8 | 102,275.8 | 1.9% | 2.2% | 3.8% | 131.7% |
الناتج المحلي الإجمالي
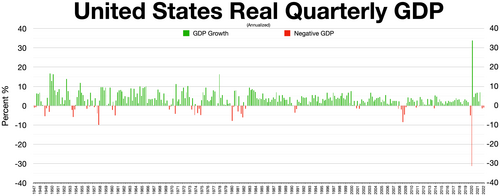


قُدّر الناتج المحلي الإجمالي الاسمي للولايات المتحدة بـ 31.856 تريليون دولار أمريكي في الربع الأول من عام 2026، وهو الأكبر في العالم. [ 128 ] وبلغ الناتج المحلي الإجمالي الاسمي السنوي 20.1 تريليون دولار أمريكي في الربع الأول من عام 2018، وهي المرة الأولى التي يتجاوز فيها 20 تريليون دولار أمريكي. يُمثّل الاستهلاك الشخصي حوالي 70% من الناتج المحلي الإجمالي الأمريكي، بينما يُمثّل استثمار الشركات 18%، والحكومة 17% (الفيدرالية والولائية والمحلية باستثناء التحويلات المالية مثل الضمان الاجتماعي، التي تُصنّف ضمن الاستهلاك)، أما صافي الصادرات فيُمثّل انخفاضًا بنسبة 3% نتيجةً للعجز التجاري الأمريكي. [ 129 ]
نما الناتج المحلي الإجمالي الحقيقي ، وهو مقياس لكل من الإنتاج والدخل، بنسبة 2.3% في عام 2017، مقابل 1.5% في عام 2016 و2.9% في عام 2015. ونما الناتج المحلي الإجمالي الحقيقي بمعدل سنوي ربع سنوي قدره 2.2% في الربع الأول من عام 2018، و4.2% في الربع الثاني من عام 2018، و3.4% في الربع الثالث من عام 2018، و2.2% في الربع الرابع من عام 2018؛ وكان معدل الربع الثاني هو أفضل معدل نمو منذ الربع الثالث من عام 2014، وكان النمو السنوي الإجمالي للناتج المحلي الإجمالي بنسبة 2.9% في عام 2018 هو أفضل أداء للاقتصاد في عقد من الزمان. [ 130 ] في عام 2020، بدأ معدل نمو الناتج المحلي الإجمالي في الانخفاض نتيجة لجائحة كوفيد-19 ، مما أدى إلى انكماش الناتج المحلي الإجمالي بمعدل نمو سنوي ربع سنوي قدره -5.0 % في الربع الأول من عام 2020 و -32.9 % في الربع الثاني من عام 2020، على التوالي.
في عام 2014، تفوقت الصين على الولايات المتحدة لتصبح أكبر اقتصاد في العالم من حيث الناتج المحلي الإجمالي (معادل القوة الشرائية)، محسوبًا وفقًا لمعدلات تحويل تعادل القوة الشرائية. وكانت الولايات المتحدة قد سجلت أعلى معدلات الناتج المحلي الإجمالي (معادل القوة الشرائية) لأكثر من قرن قبل ذلك الإنجاز؛ بينما تجاوز معدل النمو الصيني ثلاثة أضعاف معدل النمو الأمريكي في كل عام من الأعوام الأربعة الماضية. وفي عام 2017، بلغ الناتج المحلي الإجمالي للاتحاد الأوروبي ككل ما يقارب 5% أكثر من الناتج المحلي الإجمالي للولايات المتحدة، على الرغم من أن الاتحاد الأوروبي هو اتحاد سياسي وليس دولة. ومع ذلك، ظلت الولايات المتحدة أكبر اقتصاد في العالم بأعلى ناتج محلي إجمالي اسمي. [ 131 ]
بلغ نصيب الفرد من الناتج المحلي الإجمالي الحقيقي (مقاسًا بدولارات عام 2009) 52,444 دولارًا أمريكيًا في عام 2017، وقد شهد نموًا سنويًا منذ عام 2010. بلغ متوسط نموه 3.0% سنويًا في الستينيات، و2.1% في السبعينيات، و2.4% في الثمانينيات، و2.2% في التسعينيات، و0.7% في العقد الأول من الألفية الثانية، و0.9% من عام 2010 إلى عام 2017. [ 132 ] يناقش الاقتصاديون أسباب تباطؤ النمو منذ عام 2000، والتي قد تشمل شيخوخة السكان، وبطء النمو السكاني ونمو القوى العاملة، وبطء نمو الإنتاجية، وانخفاض استثمارات الشركات، وتزايد عدم المساواة في الدخل مما يقلل الطلب، ونقص الابتكارات الكبرى، وانخفاض القدرة العاملة. [ 133 ] احتلت الولايات المتحدة المرتبة العشرين من بين 220 دولة في الناتج المحلي الإجمالي للفرد عام 2017. [ 134 ] من بين رؤساء الولايات المتحدة المعاصرين، حقق بيل كلينتون أعلى نسبة تراكمية في الناتج المحلي الإجمالي الحقيقي خلال فترتي رئاسته، يليه رونالد ريغان ، ثم باراك أوباما . [ 130 ]
تطور الناتج المحلي الإجمالي للبلاد وفقًا للبنك الدولي : [ 135 ] نما الناتج المحلي الإجمالي الحقيقي للولايات المتحدة بمعدل 1.7٪ في المتوسط من عام 2000 إلى النصف الأول من عام 2014، وهو معدل يقارب نصف المتوسط التاريخي حتى عام 2000. [ 136 ]

حسب القطاع الاقتصادي
تكوين قطاعات الناتج المحلي الإجمالي الاسمي

تكوين قطاعات الناتج المحلي الإجمالي الاسمي، 2015 (بملايين الدولارات) بأسعار ثابتة لعام 2005 [ 137 ]
| البلد/الاقتصاد | الناتج المحلي الإجمالي الحقيقي | الزراعة | الصناعة | خدمة. |
|---|---|---|---|---|
| عالم | 60,093,221 | 1,968,215 | 16,453,140 | 38,396,695 |
 الولايات المتحدة الولايات المتحدة | 15,160,104 | 149,023 | 3,042,332 | 11,518,980 |
تكوين قطاعات الناتج المحلي الإجمالي الاسمي، 2016 (بملايين الدولارات) بالأسعار الجارية. [ 138 ]
| البلد/الاقتصاد | الناتج المحلي الإجمالي الاسمي | الزراعة | الصناعة | خدمة. | |
|---|---|---|---|---|---|
| الولايات المتحدة | 18,624,450 | 204,868.95 | 3,613,143.3 | 14,806,437.75 | |
| *النسب المئوية مأخوذة من كتاب حقائق العالم الصادر عن وكالة المخابرات المركزية [ 139 ] | |||||
توظيف


بلغ عدد القوى العاملة في الولايات المتحدة حوالي 160.4 مليون شخص عام 2017، ما يجعلها رابع أكبر قوة عاملة في العالم بعد الصين والهند والاتحاد الأوروبي. [ 141 ] ووظفت الحكومة (الفيدرالية والولائية والمحلية) 22 مليون شخص عام 2010. [ 142 ] وتُعد الشركات الصغيرة أكبر جهة توظيف في البلاد، حيث تمثل 37% من العمال الأمريكيين. [ 143 ] وتحتل الشركات الكبيرة المرتبة الثانية من حيث التوظيف، إذ توظف 36% من القوى العاملة الأمريكية. [ 143 ] وشكل الموظفون الإداريون 44% من القوى العاملة اعتبارًا من عام 2022، ارتفاعًا من 34% عام 2000. [ 144 ]
يوظف القطاع الخاص في الولايات المتحدة 85% من العاملين الأمريكيين، بينما تستحوذ الحكومة على 14% من إجمالي القوى العاملة الأمريكية. أكثر من 99% من مؤسسات التوظيف الخاصة في الولايات المتحدة هي شركات صغيرة. [ 143 ] وتساهم الشركات الصغيرة البالغ عددها 30 مليون شركة في الولايات المتحدة بنسبة 64% من الوظائف المستحدثة (الوظائف المستحدثة مطروحًا منها الوظائف المفقودة). [ 143 ] وشكلت الوظائف في الشركات الصغيرة 70% من الوظائف المستحدثة في العقد الماضي. [ 145 ]
ظلت نسبة الأمريكيين العاملين في الشركات الصغيرة مقابل الشركات الكبيرة ثابتة نسبيًا عامًا بعد عام، حيث تتحول بعض الشركات الصغيرة إلى شركات كبيرة، وتستمر أكثر من نصف الشركات الصغيرة لأكثر من خمس سنوات. [ 143 ] ومن بين الشركات الكبيرة، تُعدّ العديد من أكبر الشركات وأكبر جهات التوظيف في العالم شركات أمريكية. ومن بينها وول مارت ، التي تُعتبر أكبر شركة وأكبر جهة توظيف في القطاع الخاص على مستوى العالم. توظف وول مارت 2.1 مليون شخص حول العالم، و1.4 مليون شخص في الولايات المتحدة وحدها. [ 146 ] [ 147 ]


يوجد في الولايات المتحدة ما يقارب ثلاثين مليون شركة صغيرة. وتمتلك الأقليات ، كالأمريكيين من أصول إسبانية، والأمريكيين من أصول أفريقية، والأمريكيين من أصول آسيوية، والأمريكيين الأصليين (الذين يشكلون 35% من سكان البلاد)، [ 149 ] 4.1 مليون شركة من شركات البلاد. وتُدرّ هذه الشركات، المملوكة للأقليات، إيرادات تقارب 700 مليار دولار، وتوظف ما يقارب خمسة ملايين عامل في الولايات المتحدة [ 143 ] [ 150 ].
يتمتع الأمريكيون بأعلى متوسط دخل للموظفين بين دول منظمة التعاون الاقتصادي والتنمية. [ 151 ] بلغ متوسط دخل الأسرة في الولايات المتحدة 52,029 دولارًا أمريكيًا في عام 2008. [ 152 ] يعمل حوالي 284,000 شخص في الولايات المتحدة في وظيفتين بدوام كامل، بينما يعمل 7.6 مليون شخص بدوام جزئي بالإضافة إلى وظائفهم بدوام كامل. [ 142 ] ينتمي 12% من جميع العاملين في الولايات المتحدة إلى نقابات عمالية، ويعمل معظم أعضاء النقابات في القطاع الحكومي. [ 142 ] يتوازى انخفاض عضوية النقابات في الولايات المتحدة خلال العقود القليلة الماضية مع انخفاض حصة العمالة في الاقتصاد. [ 153 ] [ 154 ] [ 155 ] يصنف البنك الدولي الولايات المتحدة في المرتبة الأولى من حيث سهولة توظيف وفصل العمال. [ 156 ]
تُعدّ الولايات المتحدة الاقتصاد المتقدم الوحيد الذي لا يضمن قانونًا لعماله إجازات مدفوعة الأجر أو أيام مرضية مدفوعة الأجر ، وهي واحدة من دول قليلة في العالم لا تُقرّ إجازة عائلية مدفوعة الأجر كحق قانوني ، إلى جانب بابوا غينيا الجديدة وسورينام وليبيريا . [ 157 ] [ 158 ] [ 159 ] في عامي 2014 و2020، منح الاتحاد الدولي لنقابات العمال الولايات المتحدة درجة 4 من 5+، وهي ثالث أدنى درجة له ، في مجال حقوق العمال . [ 160 ] [ 161 ] وبالمثل، وجدت دراسة أجرتها منظمة أوكسفام عام 2023 أن الولايات المتحدة تُصنّف ضمن أسوأ الدول المتقدمة في مجال حماية العمال . [ 162 ] [ 163 ] يرى بعض الباحثين، بمن فيهم المنظّر التجاري جيفري فايفر وعالم السياسة دانيال كيندرمان، أن ممارسات التوظيف المعاصرة في الولايات المتحدة، والمتعلقة بزيادة ضغط الأداء من الإدارة، والمصاعب المفروضة على الموظفين كبيئات العمل السامة، وعدم استقرار الوظائف ، وساعات العمل الطويلة، قد تكون مسؤولة عن 120 ألف حالة وفاة زائدة سنويًا، مما يجعل مكان العمل خامس سبب رئيسي للوفاة في الولايات المتحدة. [ 164 ] [ 165 ] [ 166 ]
البطالة

في ديسمبر 2017، بلغ معدل البطالة في الولايات المتحدة 4.1% [ 167 ] ، أي ما يعادل 6.6 مليون شخص. [ 168 ] أما معدل البطالة الحكومي الأوسع نطاقًا (U-6)، والذي يشمل العاملين بدوام جزئي أو منقوص ، فبلغ 8.1% [ 169 ]، أي ما يعادل 8.2 مليون شخص. وقد حُسبت هذه الأرقام بناءً على قوة عاملة مدنية قوامها حوالي 160.6 مليون شخص، [ 170 ] مقارنةً بعدد سكان الولايات المتحدة البالغ حوالي 327 مليون نسمة. [ 171 ]
Between 2009 and 2010, following the Great Recession, the emerging problem of jobless recoveries resulted in record levels of long-term unemployment with more than six million workers looking for work for more than six months as of January 2010. This particularly affected older workers.[172] A year after the recession ended in June 2009, immigrants gained 656,000 jobs in the U.S., while U.S.-born workers lost more than a million jobs, due in part to an aging country (relatively more white retirees) and demographic shifts.[173] In April 2010, the official unemployment rate was 9.9%, but the government's broader U-6 unemployment rate was 17.1%.[174] Between February 2008 and February 2010, the number of people working part-time for economic reasons (i.e., would prefer to work full-time) increased by 4.0 million to 8.8 million, an 83% increase in part-time workers during the two-year period.[175]
By 2013, although the unemployment rate had fallen below 8%, the record proportion of long term unemployed and continued decreasing household income remained indicative of a jobless recovery.[176] However, the number of payroll jobs returned to its pre-recession (November 2007) level by May 2014 as the economy recovered.[177]
After being higher in the post-war period, the U.S. unemployment rate fell below the rising eurozone unemployment rate in the mid-1980s and has remained significantly lower almost continuously since.[178][179][180] In 1955, 55% of Americans worked in services, between 30% and 35% in industry, and between 10% and 15% in agriculture. By 1980, over 65% were employed in services, between 25% and 30% in industry, and less than 5% in agriculture.[181]Male unemployment continued to be significantly higher than those of females (at 9.8% vs. 7.5% in 2009). The unemployment among Caucasians continues being much lower than those for African-Americans (at 8.5% vs. 15.8% also in 2009).[182]
The youth unemployment rate was 18.5% in July 2009, the highest rate in that month since 1948.[183] The unemployment rate of young African Americans was 28.2% in May 2013.[184]
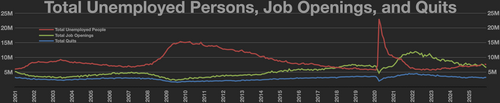
بلغ معدل البطالة أعلى مستوى له على الإطلاق عند 14.7% في أبريل 2020، قبل أن يتراجع إلى 11.1% في يونيو 2020. وبسبب تداعيات جائحة كوفيد-19 ، انخفض الناتج المحلي الإجمالي في الولايات المتحدة بنسبة 32.9% في الربع الثاني من عام 2020. [ 185 ] [ 186 ] [ 187 ] وواصل معدل البطالة انخفاضه السريع ليصل إلى 3.9% في عام 2021. [ 188 ] ثم بلغ 3.7% في مايو 2023. [ 189 ]
شهد سوق العمل الأمريكي في عام 2025 تحولاً ملحوظاً تميز بركود التوظيف وزيادة التسريحات. ووفقاً لرويترز، أعلنت الشركات الأمريكية بين يناير وسبتمبر من العام نفسه عن تسريح ما يقارب 950 ألف موظف، استحوذت قطاعات التكنولوجيا والتجزئة والحكومة على الحصة الأكبر. ووصف المحللون هذا التوجه بأنه انتقال من بيئة "لا توظيف، لا تسريح" إلى مرحلة "لا توظيف، المزيد من التسريح"، مما يعكس تزايد حذر الشركات وتباطؤ الزخم الاقتصادي. [ 190 ]
أشارت البيانات الاقتصادية الصادرة في أواخر عام 2025 إلى بوادر تباطؤ في الاقتصاد الأمريكي. فقد ارتفع معدل البطالة إلى 4.6% في نوفمبر، وهو أعلى مستوى له منذ عام 2021، بينما تباطأ خلق فرص العمل، حيث تمت إضافة 64 ألف وظيفة فقط، بانخفاض عن الأشهر السابقة. [ 191 ]
أظهرت بيانات جزئية انخفاضًا في التوظيف خلال شهر أكتوبر، حيث لاحظ المحللون تباطؤًا في وتيرة التوظيف وسط ارتفاع التضخم وزيادة تكاليف الاقتراض. في الوقت نفسه، ظلت مبيعات التجزئة ثابتة في بداية موسم العطلات، مما أثار مخاوف بشأن الإنفاق الاستهلاكي، الذي يمثل نسبة كبيرة من النشاط الاقتصادي الأمريكي. [ 192 ] [ 193 ]
بدأ الاقتصاد الأمريكي عام 2026 وهو لا يزال في وضع "شواغر مرتفعة" على منحنى بيفريدج ، الذي يدرس العلاقة بين فرص العمل المتاحة والبطالة. [ 194 ] وبحلول نهاية يناير 2026، استمرت معدلات التوظيف والتسريح منخفضة، مما سمح للبطالة بالبقاء ضمن نطاق محدد. [ 194 ] ومع ذلك، فإن انخفاض عدد فرص العمل المتاحة يعني أنه في حال ازدياد عمليات التسريح، فإن البطالة سترتفع نسبيًا أيضًا. [ 194 ]
التوظيف حسب القطاع
ينقسم التوظيف في الولايات المتحدة، وفقًا لتقديرات عام 2012، إلى 79.7% في قطاع الخدمات، و19.2% في قطاع التصنيع، و1.1% في القطاع الزراعي. [ 195 ]
الدخل والثروة


Income measures
The American daily per person median income was $70 (PPP) in 2023, one of the highest in the world.[197] Real (i.e., inflation-adjusted) median household income, a good measure of middle-class income, was $59,039 in 2016, a record level. However, it was just above the previous record set in 1998, indicating the purchasing power of middle-class family income has been stagnant or down for much of the past twenty years.[198] According to one analysis middle-class incomes in the United States fell into a tie with those in Canada in 2010, and may have fallen behind by 2014, while several other advanced economies have closed the gap in recent years.[199]
Americans have the highest average household income among OECD nations.[200][151] During 2013, employee compensation was $8.969 trillion, while gross private investment totals $2.781 trillion.[201]
Income inequality
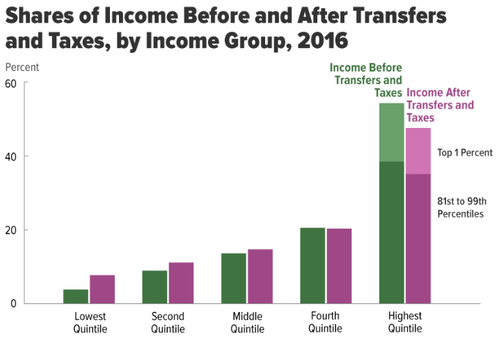
Income inequality has fluctuated considerably in the United States since measurements began around 1915, moving in an arc between peaks in the 1920s and 2000s, with a lower level of inequality from approximately 1950-1980 (a period named the Great Compression), followed by increasing inequality, in what has been coined as the great divergence.
The U.S. has the highest level of income inequality among its (post-industrialized) peers.[202] When measured for all households, U.S. income inequality is comparable to other developed countries before taxes and transfers, but is among the highest after taxes and transfers, meaning the U.S. shifts relatively less income from higher income households to lower income households. In 2016, average market income was $15,600 for the lowest quintile and $280,300 for the highest quintile. The degree of inequality accelerated within the top quintile, with the top 1% at $1.8 million, approximately 30 times the $59,300 income of the middle quintile.[203]
قد تشمل الآثار الاقتصادية والسياسية لعدم المساواة تباطؤ نمو الناتج المحلي الإجمالي، وانخفاض الحراك الاجتماعي للدخل ، وارتفاع معدلات الفقر، وزيادة الاعتماد على ديون الأسر ، مما يؤدي إلى زيادة خطر الأزمات المالية، والاستقطاب السياسي . [ 204 ] [ 205 ] وتشمل أسباب عدم المساواة زيادة رواتب المديرين التنفيذيين مقارنةً بالعامل العادي، وهيمنة القطاع المالي ، وزيادة تركيز الصناعات ، وانخفاض معدلات الانضمام إلى النقابات ، وانخفاض معدلات الضرائب الفعلية على الدخول المرتفعة، والتغيرات التكنولوجية التي تكافئ التحصيل العلمي العالي. [ 206 ]
يُعدّ قياس عدم المساواة موضوعًا مثيرًا للجدل، نظرًا لاختلاف مقاييسها اختلافًا كبيرًا، على سبيل المثال، بين مجموعات البيانات [ 207 ] [ 208 ] ، أو ما إذا كان القياس يعتمد على التعويض النقدي (دخل السوق) أو بعد خصم الضرائب والتحويلات المالية . يُعدّ معامل جيني إحصائية مقبولة على نطاق واسع، تسمح بإجراء مقارنات بين مختلف الأنظمة القانونية، حيث يشير الصفر إلى المساواة التامة، بينما يشير الواحد إلى أقصى درجات عدم المساواة. علاوة على ذلك، تقيس العديد من مجموعات البيانات العامة والخاصة هذه الدخول، على سبيل المثال، من مكتب الميزانية في الكونغرس (CBO) [ 203 ] ، ودائرة الإيرادات الداخلية، ومكتب الإحصاء [ 209 ] . ووفقًا لمكتب الإحصاء، فقد بلغ عدم المساواة في الدخل مستويات قياسية في عام 2018، حيث بلغ معامل جيني 0.485 [ 210 ]. ومنذ ذلك الحين، قدّم مكتب الإحصاء قيمًا بلغت 0.488 في عام 2020 و0.494 في عام 2021، وذلك لكل وحدة دخل نقدي قبل خصم الضرائب [ 211 ] .
تُعتبر سياسات الضرائب والتحويلات في الولايات المتحدة تصاعدية ، وبالتالي تُقلل من التفاوت الفعلي في الدخل، حيث ترتفع معدلات الضرائب عمومًا مع ارتفاع الدخل الخاضع للضريبة. ولا يدفع العمال ذوو الدخل الأدنى ، وخاصةً من يعولون أحدًا، ضرائب دخل، بل قد يحصلون على دعم بسيط من الحكومة الفيدرالية (من خلال إعفاءات الأطفال وائتمان ضريبة الدخل المكتسب ). [ 212 ] بلغ معامل جيني في الولايات المتحدة عام 2016، بناءً على دخل السوق، 0.59؛ وانخفض إلى 0.42 بعد الضرائب والتحويلات، وفقًا لبيانات مكتب الميزانية في الكونغرس . ارتفعت حصة أعلى 1% من دخل السوق من 9.6% عام 1979 إلى ذروة بلغت 20.7% عام 2007، قبل أن تنخفض إلى 17.5% بحلول عام 2016. وبعد الضرائب والتحويلات، أصبحت هذه النسب 7.4% و16.6% و12.5% على التوالي. [ 203 ]
صافي ثروة الأسر وعدم المساواة في الثروة


في الربع الأخير من عام 2017، بلغ صافي ثروة الأسر في الولايات المتحدة رقماً قياسياً قدره 99 تريليون دولار، بزيادة قدرها 5.2 تريليون دولار عن عام 2016. وتعكس هذه الزيادة مكاسب سوق الأسهم وأسعار المساكن. وقد سجل هذا المؤشر أرقاماً قياسية منذ الربع الأخير من عام 2012. [ 214 ] وإذا قُسِّم المبلغ بالتساوي، فإن 99 تريليون دولار تمثل متوسط 782,000 دولار لكل أسرة (لحوالي 126.2 مليون أسرة) أو 302,000 دولار للفرد. مع ذلك، بلغ متوسط صافي ثروة الأسر (أي نصف الأسر التي تقع فوق هذا المستوى ونصف الأسر التي تقع تحته) 97,300 دولار في عام 2016. وكان متوسط صافي ثروة الأسر التي تقع ضمن أدنى 25% من الأسر صفراً، بينما بلغ متوسط صافي ثروة الأسر التي تقع ضمن الشريحة المئوية من 25 إلى 50، 40,000 دولار. [ 215 ]
يُعدّ التفاوت في الثروة أشدّ وطأةً من التفاوت في الدخل، إذ امتلكت أغنى 1% من الأسر ما يقارب 42% من صافي الثروة عام 2012، مقابل 24% عام 1979. [ 216 ] ووفقًا لتقرير صادر عن مجلس الاحتياطي الفيدرالي في سبتمبر 2017، بلغ التفاوت في الثروة مستويات قياسية؛ إذ سيطر أغنى 1% على 38.6% من ثروة البلاد عام 2016. [ 217 ] وتوقعت مجموعة بوسطن الاستشارية في تقريرها الصادر في يونيو 2017 أن يسيطر 1% من الأمريكيين على 70% من ثروة البلاد بحلول عام 2021. [ 218 ]
يمتلك أغنى 10% من السكان 80% من إجمالي الأصول المالية. [ 219 ] يُعدّ التفاوت في الثروة في الولايات المتحدة أكبر منه في معظم الدول المتقدمة باستثناء السويد. [ 220 ] قد تُفسّر الثروة الموروثة سبب تمتع العديد من الأمريكيين الأثرياء بـ"بداية قوية". [ 221 ] [ 222 ] في سبتمبر 2012، ووفقًا لمعهد دراسات السياسات ، فإن "أكثر من 60%" من أغنى 400 أمريكي وفقًا لمجلة فوربس "نشأوا في بيئة مرفهة". [ 223 ] انخفض متوسط ثروة الأسر بنسبة 35% في الولايات المتحدة، من 106,591 دولارًا إلى 68,839 دولارًا بين عامي 2005 و2011، بسبب الركود الكبير ، ولكنه تعافى منذ ذلك الحين كما ذُكر أعلاه. [ 224 ]
يقطن حوالي 30% من إجمالي أصحاب الملايين في العالم في الولايات المتحدة ( حتى عام 2009).).[225] The Economist Intelligence Unit estimated in 2008 that there were 16,600,000 millionaires in the U.S.[226] Furthermore, 34% of the world's billionaires are American (in 2011).[227][228]
Home ownership

The U.S. home ownership rate in Q1 2018 was 64.2%, well below the all-time peak of 69.2% set in Q4 2004 during a housing bubble. Millions of homes were lost to foreclosure during the Great Recession of 2007–2009, bringing the ownership rate to a trough of 62.9% in Q2 2016. The average ownership rate from 1965 to 2017 was 65.3%.[229]
The average home in the United States has more than 700 square feet per person (65 square meters), which is 50%–100% more than the average in other high-income countries. Similarly, ownership rates of gadgets and amenities are relatively high compared to other countries.[230][231][232]
It was reported by Pew Research Center in 2016 that, for the first time in 130 years, Americans aged 18 to 34 are more likely to live with their parents than in any other housing situation.[233]
In one study by ATTOM Data Solutions, in 70% of the counties surveyed, homes are increasingly unaffordable for the average U.S. worker.[234]
As of 2018, the number of U.S. citizens residing in their vehicles increased in major cities with significantly higher than average housing costs such as Los Angeles, Portland and San Francisco.[235][236]
According to CNBC, the median sale price for a U.S. home in 2017 was US$199,200.[237] By February 2023, the median U.S. home sale price grew to US$392,000 according to Statista.[238] The US has a country-wide housing shortage caused by insufficient housing construction (which declined severely after the 2008 Great Recession), and has caused rents and home prices to rise to increasingly unaffordable levels, with one estimate of the shortage being 3.8 million units in 2019, with this shortage having gotten worse during and since the pandemic.[239][240]
اعتبارًا من يناير 2024، يحتاج العاملون في حوالي نصف المدن الأمريكية إلى دخل قدره 100 ألف دولار أو أكثر لشراء منزل نتيجة لارتفاع أسعار المساكن وزيادة أسعار الفائدة. [ 241 ]
الأرباح والأجور

انخفضت الأجور الحقيقية (الأجور المعدلة وفقًا للتضخم) لمعظم العاملين في الولايات المتحدة، وكذلك متوسط الدخل، أو ظلت راكدة خلال العشرين إلى الأربعين عامًا الماضية. [ 242 ] [ 243 ] [ 244 ] [ 245 ] وأظهر تحليل جزئي أُجري عام 2020 أن حصة العمل من الناتج القومي انخفضت خلال العقود الأربعة السابقة، بينما ارتفعت حصة الأرباح من الناتج نفسه خلال الفترة نفسها. [ 246 ]
في عام 1970، مثّلت الأجور أكثر من 51% من الناتج المحلي الإجمالي للولايات المتحدة، بينما كانت الأرباح أقل من 5%. ولكن بحلول عام 2013، انخفضت الأجور إلى 44% من الاقتصاد، في حين تضاعفت الأرباح إلى أكثر من الضعف لتصل إلى 11%. [ 247 ] ارتفع متوسط الدخل الشخصي المتاح للفرد (الحقيقي) المعدل حسب التضخم بشكل مطرد في الولايات المتحدة من عام 1945 إلى عام 2008، ولكنه ظل مستقرًا بشكل عام منذ ذلك الحين. [ 248 ] [ 249 ]
في عام 2005، تراوح متوسط الدخل الشخصي لمن تزيد أعمارهم عن 18 عامًا بين 3,317 دولارًا أمريكيًا لامرأة أمريكية آسيوية متزوجة عاطلة عن العمل [ 250 ] و55,935 دولارًا أمريكيًا لرجل أمريكي آسيوي يعمل بدوام كامل طوال العام. [ 251 ] ووفقًا لتعداد الولايات المتحدة، كان دخل الرجال أعلى من دخل النساء، بينما كان دخل الآسيويين والبيض أعلى من دخل الأمريكيين من أصل أفريقي واللاتينيين . وبلغ متوسط الدخل الشخصي الإجمالي لجميع الأفراد الذين تزيد أعمارهم عن 18 عامًا 24,062 دولارًا أمريكيًا [ 252 ] (32,140 دولارًا أمريكيًا لمن تبلغ أعمارهم 25 عامًا فأكثر) في عام 2005. [ 253 ]
للمقارنة، كان الحد الأدنى للأجور في عامي 2009 و2017 هو 7.25 دولارًا أمريكيًا للساعة، أو 15,080 دولارًا أمريكيًا مقابل 2080 ساعة عمل في السنة. ويزيد هذا الحد الأدنى للأجور قليلًا عن مستوى الفقر للفرد الواحد، ويُعادل حوالي 50% من مستوى الفقر لعائلة مكونة من أربعة أفراد.
بحسب تقرير صادر عن مركز بيو للأبحاث في أكتوبر 2014 ، ظلت الأجور الحقيقية ثابتة أو متراجعة على مدى العقود الخمسة الماضية بالنسبة لمعظم العمال الأمريكيين، بغض النظر عن نمو الوظائف. [ 254 ] وأفادت بلومبيرغ في يوليو 2018 أن الناتج المحلي الإجمالي الحقيقي للفرد قد نما بشكل ملحوظ منذ الركود الكبير. [ 255 ]
أظهر استطلاع أجرته مؤسسة CareerBuilder في أغسطس/آب 2017 أن ثمانية من كل عشرة عاملين في الولايات المتحدة يعيشون على رواتبهم الشهرية. وأرجع المتحدث باسم المؤسسة، مايك إروين، ذلك إلى "ركود الأجور وارتفاع تكلفة كل شيء، بدءًا من التعليم وصولًا إلى العديد من السلع الاستهلاكية". [ 256 ] ووفقًا لاستطلاع أجراه المكتب الفيدرالي لحماية المستهلك المالي حول الوضع المالي للمواطنين الأمريكيين، يواجه ما يقرب من نصفهم صعوبة في سداد فواتيرهم، بينما واجه أكثر من ثلثهم مصاعب جمة، كعدم القدرة على تحمل تكاليف السكن، أو نفاد الطعام، أو عدم كفاية المال لتغطية نفقات الرعاية الصحية. [ 257 ] ووفقًا للصحفية والكاتبة أليسا كوارت ، فإن تكلفة المعيشة تتجاوز نمو الرواتب والأجور بوتيرة متسارعة، بما في ذلك رواتب المهن التي كانت تُعتبر تقليديًا آمنة، مثل التدريس. وكتبت أن "تكلفة المعيشة للطبقة المتوسطة أصبحت الآن أعلى بنسبة 30% مما كانت عليه قبل 20 عامًا". [ 258 ]
في فبراير 2019، أفاد بنك الاحتياطي الفيدرالي في نيويورك أن سبعة ملايين مواطن أمريكي متأخرون عن سداد أقساط سياراتهم لثلاثة أشهر أو أكثر، مسجلين بذلك رقماً قياسياً. ويعتبر الاقتصاديون هذا مؤشراً خطيراً على معاناة الأمريكيين في سداد فواتيرهم رغم انخفاض معدل البطالة. [ 259 ] وأظهر استطلاع رأي أجرته الإذاعة الوطنية العامة (NPR) في مايو 2019 أن 40% من سكان الريف الأمريكيين يعانون من صعوبة في دفع تكاليف الرعاية الصحية والغذاء والسكن، وأن 49% منهم لا يستطيعون دفع مبلغ 1000 دولار نقداً في حالة طارئة، وسيختارون بدلاً من ذلك الاقتراض لتغطية مثل هذه النفقات الطارئة غير المتوقعة. [ 260 ] ويؤكد بعض الخبراء أن الولايات المتحدة شهدت "انتعاشاً ذا مستويين"، استفاد منه 60% من السكان، بينما يعاني الـ 40% المتبقون في "المستوى الأدنى" من صعوبة سداد فواتيرهم نتيجة ركود الأجور، وارتفاع تكاليف السكن والتعليم والرعاية الصحية، وتزايد الديون. [ 261 ]
أظهرت دراسة أجرتها "التحالف الوطني للإسكان لذوي الدخل المنخفض" عام 2021 أن على العاملين أن يتقاضوا ما لا يقل عن 24.90 دولارًا أمريكيًا في الساعة ليتمكنوا من تحمل تكاليف استئجار منزل قياسي مكون من غرفتي نوم (أي ما يعادل 30% أو أقل من دخل الفرد)، أو 20.40 دولارًا أمريكيًا لمنزل مكون من غرفة نوم واحدة في أي مكان في الولايات المتحدة. ويُعدّ الرقم الأول أعلى بـ 3.4 مرة من الحد الأدنى للأجور الفيدرالية الحالي. [ 262 ]
أفاد مكتب الإحصاء الأمريكي في سبتمبر 2023 أن الدخول انخفضت العام الماضي بنسبة 2.3% مقارنة بعام 2021، وهو العام الثالث على التوالي الذي تشهد فيه الدخول انخفاضاً. [ 263 ]
بحسب تحليل أجراه اقتصاديون في الاحتياطي الفيدرالي عام 2026، انخفضت حصة العمال الأمريكيين من الدخل القومي إلى أدنى مستوى لها منذ عام 1947، في حين تستحوذ الشركات والمستثمرون الأثرياء على حصة متزايدة باستمرار. [ 264 ]
فقر

منذ ثمانينيات القرن الماضي، تجاوزت معدلات الفقر النسبي في الولايات المتحدة باستمرار مثيلاتها في الدول الغنية الأخرى، على الرغم من أن التحليلات التي تستخدم مجموعة بيانات مشتركة للمقارنة تشير إلى أن معدل الفقر المطلق في الولايات المتحدة، بحسب دخل السوق، أقل من معظم الدول الغنية الأخرى. [ 265 ] تضاعف الفقر المدقع في الولايات المتحدة، أي الأسر التي تعيش على أقل من دولارين أمريكيين في اليوم قبل المساعدات الحكومية، من مستويات عام 1996 إلى 1.5 مليون أسرة في عام 2011، بما في ذلك 2.8 مليون طفل. [ 266 ] في عام 2013، بلغ فقر الأطفال مستويات قياسية، حيث بلغ عدد الأطفال الذين يعيشون في أسر تعاني من انعدام الأمن الغذائي 16.7 مليون طفل ، أي بزيادة قدرها 35% تقريبًا عن مستويات عام 2007. [ 267 ] اعتبارًا من عام 2015، يعيش 44% من الأطفال في الولايات المتحدة مع أسر منخفضة الدخل. [ 268 ]
في عام 2016، بلغت نسبة الفقر في الولايات المتحدة 12.7% ، بانخفاض عن 13.5% في عام 2015. وكانت نسبة الفقر قد ارتفعت من 12.5% في عام 2007 قبل الأزمة المالية العالمية إلى ذروتها عند 15.1% في عام 2010، قبل أن تعود إلى مستوى أعلى بقليل من مستوى عام 2007. وفي الفترة ما بين عامي 1959 و1962، تجاوزت نسبة الفقر 20%، لكنها انخفضت إلى أدنى مستوى لها على الإطلاق عند 11.1% في عام 1973 عقب بدء حملة مكافحة الفقر خلال رئاسة ليندون جونسون. [ 269 ] وفي يونيو/حزيران 2016، حذر صندوق النقد الدولي الولايات المتحدة من ضرورة معالجة ارتفاع نسبة الفقر فيها بشكل عاجل. [ 270 ]

ارتفع عدد سكان الأحياء الفقيرة للغاية بمقدار الثلث بين عامي 2000 و2009. [ 272 ] ويعاني سكان هذه الأحياء عادةً من عدم كفاية فرص الحصول على تعليم جيد، وارتفاع معدلات الجريمة، وارتفاع معدلات الأمراض الجسدية والنفسية، ومحدودية فرص الحصول على الائتمان وتكوين الثروة، وارتفاع أسعار السلع والخدمات، وقلة فرص العمل. [ 272 ] وفي عام 2013، صُنِّف 44% من فقراء أمريكا ضمن فئة "الفقر المدقع"، حيث يقل دخلهم بنسبة 50% أو أكثر عن خط الفقر الرسمي الذي حددته الحكومة. [ 273 ]
وفقًا للتقرير السنوي لتقييم المشردين الصادر عن وزارة الإسكان والتنمية الحضرية الأمريكية، اعتبارًا من عام 2024بلغ عدد المشردين في الولايات المتحدة حوالي 771,480 شخصًا في ليلة معينة، أي ما يعادل 23 شخصًا من كل 10,000 شخص. [ 274 ] [ 275 ] أقام ما يقرب من ثلثي هؤلاء في ملاجئ طوارئ أو برامج إسكان انتقالي، بينما عاش الثلث الآخر في الشوارع أو في مبانٍ مهجورة أو أماكن أخرى غير مخصصة للسكن. استخدم حوالي 1.56 مليون شخص، أي ما يعادل 0.5% من سكان الولايات المتحدة، ملاجئ الطوارئ أو برامج الإسكان الانتقالي بين 1 أكتوبر 2008 و30 سبتمبر 2009. [ 276 ] يعمل حوالي 44% من المشردين. [ 277 ] ازدادت نسبة التشرد بين عامي 2016 و2020، بالتزامن مع ارتفاع عدد الوفيات بين المشردين. [ 278 ]

تُعدّ الولايات المتحدة من بين الدول الأقل شمولاً في مجال شبكات الأمان الاجتماعي في العالم المتقدم، حيث تُساهم في خفض معدلات الفقر النسبي والفقر المُطلق بنسبة أقل بكثير من المتوسط في الدول الغنية . [ 279 ] [ 280 ] [ 281 ] [ 282 ] [ 283 ] ويرى بعض الخبراء أن الفقراء يعيشون في ظروف تُضاهي ظروف العالم النامي . [ 284 ] [ 285 ] وقد خلص تقرير صادر في مايو/أيار 2018 عن المقرر الخاص للأمم المتحدة المعني بالفقر المدقع وحقوق الإنسان إلى أن أكثر من خمسة ملايين شخص في الولايات المتحدة يعيشون في ظروف تُشبه ظروف دول العالم الثالث. [ 286 ] ويُعدّ الفقر رابع أهم عامل خطر للوفاة المبكرة سنوياً، وفقاً لدراسة نُشرت في مجلة الجمعية الطبية الأمريكية (JAMA) عام 2023 . [ 287 ] [ 288 ] [ 289 ] على مدى العقود الثلاثة الماضية، سُجن الفقراء في أمريكا بمعدل أعلى بكثير من نظرائهم في الدول المتقدمة الأخرى، حيث أصبح الحبس الجنائي "أمرًا شائعًا بين الفقراء من الرجال في سن العمل". [ 290 ] يرى بعض الباحثين أن التحول إلى السياسات الاجتماعية والاقتصادية النيوليبرالية بدءًا من أواخر السبعينيات قد وسّع نطاق الدولة العقابية، وقلّص دولة الرفاه الاجتماعي ، وحرّر الاقتصاد، وجرّم الفقر، مما أدى في نهاية المطاف إلى "تغيير مفهوم الفقر في أمريكا". [ 291 ] [ 292 ] [ 293 ]
يذكر عالم الاجتماع ماثيو ديزموند في كتابه "الفقر في أمريكا" الصادر عام 2023 أن الولايات المتحدة "تقدم بعضًا من أدنى الأجور في العالم الصناعي"، مما "أدى إلى تضخم أعداد الفقراء العاملين، ومعظمهم يبلغون من العمر 35 عامًا أو أكثر". [ 294 ] ويؤكد عالم الاجتماع مارك روبرت رانك أن ارتفاع معدلات الفقر في الولايات المتحدة يمكن تفسيره إلى حد كبير على أنه إخفاقات هيكلية على المستويين الاقتصادي والسياسي. [ 295 ]
الرعاية الصحية


التغطية
يتألف النظام الأمريكي من مزيج من التأمين الصحي العام والخاص. توفر الحكومة تغطية تأمينية لحوالي 53 مليون مسن عبر برنامج الرعاية الطبية (Medicare) ، و62 مليون شخص من ذوي الدخل المنخفض عبر برنامج المساعدة الطبية (Medicaid) ، و15 مليون من قدامى المحاربين عبر إدارة شؤون المحاربين القدامى . ويتلقى حوالي 178 مليون موظف في الشركات تأمينًا صحيًا مدعومًا من خلال جهة عملهم، بينما يشتري 52 مليون شخص آخر التأمين مباشرةً إما عبر منصات التبادل المدعومة التي تم تطويرها كجزء من قانون الرعاية الصحية الميسرة ، أو مباشرةً من شركات التأمين. ويقدم القطاع الخاص خدمات الرعاية الصحية، باستثناء إدارة شؤون المحاربين القدامى، حيث يعمل الأطباء فيها لدى الحكومة. [ 299 ]
تشير استطلاعات رأي متعددة إلى انخفاض عدد غير المؤمن عليهم صحيًا بين عامي 2013 و2016 نتيجة لتوسيع نطاق أهلية برنامج ميديكيد وإنشاء بورصات التأمين الصحي بموجب قانون حماية المرضى والرعاية الصحية الميسرة ، المعروف أيضًا باسم "قانون الرعاية الصحية الميسرة" أو "أوباما كير". ووفقًا لمكتب الإحصاء الأمريكي ، بلغ عدد غير المؤمن عليهم صحيًا في الولايات المتحدة 45.6 مليون شخص عام 2012 (14.8% من السكان دون سن 65 عامًا). وانخفض هذا الرقم بمقدار 18.3 مليون شخص (40%) ليصل إلى 27.3 مليون شخص (8.6% من السكان دون سن 65 عامًا) بحلول عام 2016. [ 300 ]
مع ذلك، في عهد الرئيس ترامب، بدأت هذه المكاسب في التغطية الصحية بالتراجع. فقد قدّر صندوق الكومنولث في مايو 2018 أن عدد غير المؤمن عليهم صحيًا قد ازداد بمقدار أربعة ملايين شخص بين أوائل عام 2016 وأوائل عام 2018. وارتفعت نسبة غير المؤمن عليهم من 12.7% في عام 2016 إلى 15.5%. وكان التأثير أكبر بين البالغين ذوي الدخل المنخفض، حيث كانت نسبة غير المؤمن عليهم أعلى من نسبة غير المؤمن عليهم بين البالغين ذوي الدخل المرتفع. وعلى الصعيد الإقليمي، سجلت المناطق الجنوبية والغربية نسبًا أعلى من غير المؤمن عليهم مقارنةً بالمناطق الشمالية والشرقية. علاوة على ذلك، سجلت الولايات الثماني عشرة التي لم توسّع برنامج ميديكيد نسبة أعلى من غير المؤمن عليهم مقارنةً بتلك التي فعلت ذلك. [ 301 ]
بحسب منظمة "أطباء من أجل برنامج صحي وطني" ، يتسبب انعدام التأمين الصحي في حوالي 48,000 حالة وفاة غير ضرورية سنويًا. [ 302 ] وقد انتقد جون سي. غودمان منهجية المنظمة لعدم مراعاتها سبب الوفاة أو تتبعها لتغيرات حالة التأمين الصحي بمرور الوقت، بما في ذلك وقت الوفاة. [ 303 ] وخلصت دراسة أجراها ريتشارد كرونيك، المستشار السياسي السابق للرئيس كلينتون، عام 2009 ، إلى عدم وجود زيادة في معدل الوفيات نتيجة انعدام التأمين الصحي بعد ضبط بعض عوامل الخطر. [ 304 ]
النتائج
تتخلف الولايات المتحدة في الأداء العام للرعاية الصحية، لكنها رائدة عالميًا في الابتكار الطبي . فقد طورت أمريكا وحدها أو ساهمت بشكل كبير في تسعة من أهم عشرة ابتكارات طبية منذ عام 1975، وفقًا لتصنيف استطلاع رأي للأطباء عام 2001، بينما ساهم الاتحاد الأوروبي وسويسرا معًا في خمسة منها. ومنذ عام 1966، حصل الأمريكيون على جوائز نوبل في الطب أكثر من بقية دول العالم مجتمعة. وفي الفترة من 1989 إلى 2002، استُثمر في شركات التكنولوجيا الحيوية الخاصة في أمريكا أربعة أضعاف ما استُثمر في أوروبا. [ 305 ] [ 306 ]
من بين 17 دولة ذات دخل مرتفع أجرت عليها المعاهد الوطنية للصحة دراسة عام 2013، احتلت الولايات المتحدة مرتبة متقدمة أو قريبة منها في معدلات السمنة، وتكرار استخدام السيارات والحوادث، وجرائم القتل، ومعدل وفيات الرضع ، وانتشار أمراض القلب والرئة، والأمراض المنقولة جنسيًا، وحالات الحمل لدى المراهقات، والوفيات الناجمة عن تعاطي المخدرات أو الكحول، والإصابات، ومعدلات الإعاقة. وتضع هذه العوامل المتعلقة بنمط الحياة والمجتمع الولايات المتحدة في ذيل قائمة متوسط العمر المتوقع. ففي المتوسط، يُتوقع أن يعيش الرجل الأمريكي أقل بأربع سنوات تقريبًا من نظيره في الدولة الأعلى تصنيفًا، مع العلم أن الأمريكيين الذين يبلغون سن 75 عامًا يعيشون أطول من نظرائهم في الدول المماثلة. [ 307 ] ومن بين خيارات الاستهلاك التي تُسبب العديد من الأمراض المذكورة أعلاه، السجائر. فقد دخن الأمريكيون 258 مليار سيجارة عام 2016. [ 308 ] وتُكلف السجائر الولايات المتحدة 326 مليار دولار سنويًا، منها 170 مليار دولار تكاليف رعاية صحية مباشرة، و156 مليار دولار خسائر في الإنتاجية . [ 308 ]
أظهرت دراسة شاملة أجراها أطباء أوروبيون عام 2007 أن معدل البقاء على قيد الحياة لمدة خمس سنوات لمرضى السرطان في الولايات المتحدة أعلى بكثير من جميع الدول الأوروبية الـ 21 التي شملتها الدراسة، حيث بلغ 66.3% للرجال مقابل المتوسط الأوروبي البالغ 47.3%، و62.9% مقابل 52.8% للنساء. [ 309 ] [ 310 ] يخضع الأمريكيون لفحوصات الكشف عن السرطان بمعدلات أعلى بكثير من سكان الدول المتقدمة الأخرى، ويحصلون على فحوصات التصوير بالرنين المغناطيسي والتصوير المقطعي المحوسب بأعلى معدل بين دول منظمة التعاون الاقتصادي والتنمية. [ 311 ] يحصل الأشخاص في الولايات المتحدة الذين تم تشخيص إصابتهم بارتفاع الكوليسترول أو ارتفاع ضغط الدم على العلاجات الدوائية بمعدلات أعلى من أولئك الذين تم تشخيص إصابتهم في الدول المتقدمة الأخرى، وهم أكثر عرضة للسيطرة على حالتهم بنجاح. [ 312 ] [ 313 ] مرضى السكري أكثر عرضة لتلقي العلاج وتحقيق أهداف العلاج في الولايات المتحدة مقارنة بكندا أو إنجلترا أو اسكتلندا. [ 314 ] [ 315 ]
وفقًا لدراسة أجراها معهد القياسات الصحية والتقييم عام 2018 استنادًا إلى بيانات عام 2016 ، احتلت الولايات المتحدة المرتبة 27 عالميًا في مجال الرعاية الصحية والتعليم، بعد أن كانت في المرتبة السادسة عام 1990. [ 316 ]
يكلف
تُعدّ تكاليف الرعاية الصحية في الولايات المتحدة أعلى بكثير من مثيلاتها في الدول الأخرى كنسبة من الناتج المحلي الإجمالي، وذلك وفقًا لعدة معايير. فبحسب منظمة التعاون الاقتصادي والتنمية، بلغت تكاليف الرعاية الصحية في الولايات المتحدة عام 2015 نسبة 16.9% من الناتج المحلي الإجمالي، أي أعلى بأكثر من 5% من الناتج المحلي الإجمالي مقارنةً بالدولة التالية في قائمة الدول الأعضاء في المنظمة. [ 317 ] ويمثل هذا الفارق البالغ 5% من الناتج المحلي الإجمالي تريليون دولار أمريكي، أي ما يعادل حوالي 3000 دولار أمريكي للفرد، أو ما يزيد بمقدار الثلث مقارنةً بالدولة التالية في قائمة الدول الأعضاء. [ 318 ]
يُعزى ارتفاع تكلفة الرعاية الصحية في الولايات المتحدة إلى عدة عوامل، منها التقدم التكنولوجي، وتكاليف الإدارة، وأسعار الأدوية، وارتفاع أسعار المعدات الطبية لدى الموردين، وتلقي الأمريكيين رعاية طبية أكثر من نظرائهم في دول أخرى، وارتفاع أجور الأطباء، واللوائح الحكومية، وتأثير الدعاوى القضائية، وأنظمة الدفع من جهات خارجية التي تحمي المستهلكين من التكلفة الكاملة للعلاجات. [ 319 ] [ 320 ] [ 321 ] وتُقدم الخطط الحكومية أقل الأسعار للأدوية والأجهزة الطبية وأجور الأطباء. ويميل الأمريكيون إلى تلقي رعاية طبية أكثر من نظرائهم في دول أخرى، وهو ما يُسهم بشكل ملحوظ في ارتفاع التكاليف. ففي الولايات المتحدة، تزداد احتمالية خضوع الشخص لجراحة القلب المفتوح بعد الإصابة بنوبة قلبية مقارنةً بغيره من الدول. ويدفع برنامج Medicaid مبالغ أقل من برنامج Medicare للعديد من الأدوية الموصوفة، وذلك لأن خصومات Medicaid محددة بموجب القانون، بينما يتم التفاوض على أسعار Medicare من قِبل شركات التأمين الخاصة وشركات الأدوية. [ 320 ] [ 322 ] غالبًا ما تدفع الخطط الحكومية أقل من التكاليف التشغيلية، مما يؤدي إلى قيام مقدمي الرعاية الصحية بتحميل التكلفة على المؤمن عليهم من القطاع الخاص من خلال رفع الأسعار. [ 323 ] [ 324 ]
تكوين القطاعات الاقتصادية
القطاعات الأولية


تُعدّ الزراعة في الولايات المتحدة قطاعًا رئيسيًا في البلاد، التي تُصدّر كميات صافية من الغذاء. [ 325 ] ووفقًا لتعداد الزراعة لعام 2017 ، بلغ عدد المزارع 2.04 مليون مزرعة، تغطي مساحة 900 مليون فدان (1,400,000 ميل مربع )، بمتوسط 441 فدانًا (178 هكتارًا) لكل مزرعة. [ 326 ]
تتركز الأنشطة الزراعية بشكل خاص في وادي كاليفورنيا الأوسط والسهول الكبرى . تُعدّ السهول الكبرى مساحة شاسعة من الأراضي الزراعية المسطحة في وسط البلاد، تغطي منطقة غرب البحيرات العظمى وشرق جبال روكي . يُعرف النصف الشرقي الأكثر رطوبة بمنطقة إنتاج الذرة وفول الصويا الرئيسية، ويُعرف باسم حزام الذرة ، بينما يُعرف النصف الغربي الأكثر جفافًا باسم حزام القمح نظرًا لارتفاع معدل إنتاج القمح فيه. [327] ينتج وادي كاليفورنيا الأوسط الفواكه والخضراوات والمكسرات. لطالما كان جنوب الولايات المتحدة منتجًا رئيسيًا للقطن والتبغ والأرز ، إلا أن إنتاجه الزراعي تراجع خلال القرن الماضي . تتصدر فلوريدا الولايات المتحدة في إنتاج الحمضيات ، وتحتل المرتبة الثانية عالميًا في إنتاج البرتقال بعد البرازيل فقط .
قادت الولايات المتحدة الأمريكية التطورات في مجال تحسين البذور، كالتهجين ، وفي توسيع استخدامات المحاصيل، بدءًا من أعمال جورج واشنطن كارفر وصولًا إلى البلاستيك الحيوي والوقود الحيوي . وشكّلت ميكنة الزراعة والزراعة المكثفة سمةً بارزةً في تاريخ الولايات المتحدة ، بما في ذلك محراث جون دير الفولاذي، وحصادة سايروس ماكورميك الميكانيكية ، ومحلج القطن لإيلي ويتني ، والنجاح الواسع لجرار فوردسون والحصادة المركبة . وتتراوح الزراعة الحديثة في الولايات المتحدة بين المزارع الصغيرة ومزارع الهواة، وصولًا إلى المزارع التجارية الكبيرة التي تغطي آلاف الأفدنة من الأراضي الزراعية أو المراعي .
تشمل المنتجات الزراعية القمح والذرة والحبوب الأخرى والفواكه والخضروات والقطن ؛ ولحم البقر ولحم الخنزير والدواجن ومنتجات الألبان ومنتجات الغابات والمأكولات البحرية.


تُستمد الطاقة في الولايات المتحدة من مصادر متنوعة، إلا أن معظمها كان من الوقود الأحفوري في عام 2023: 38% من طاقة البلاد مصدرها البترول ، و36% الغاز الطبيعي ، و9% الفحم . وساهمت الطاقة النووية بنسبة 9%، وكذلك الطاقة المتجددة بنسبة 9%، والتي تشمل الكتلة الحيوية ، وطاقة الرياح ، والطاقة الكهرومائية ، والطاقة الشمسية ، والطاقة الحرارية الأرضية . [ 330 ] [ 328 ] وكان استهلاك الطاقة في عام 2023 مُوجهاً في معظمه للصناعة (33%) والنقل (30%)، بينما شكل الاستهلاك المنزلي (20%) والمباني التجارية (17%) النسبة المتبقية. [ 331 ] [ 332 ] وبلغت القدرة الاسمية لشبكة الكهرباء الأمريكية في أمريكا الشمالية 1280 جيجاواط [ 333 ] ، وأنتجت 4029 تيراواط ساعة [ 334 ] في عام 2023، مستخدمةً 34% من الطاقة الأولية. [ 335 ]
تفوق الغاز الطبيعي على الفحم كمصدر رئيسي لتوليد الكهرباء في عام 2016. وتفوقت الطاقة النووية على الفحم لأول مرة في عام 2020، ثم تفوقت مصادر الطاقة المتجددة في عام 2023. [ 334 ]
تُقاس قيم الطاقة بوحدة BTU ، حيث تساوي وحدة BTU واحدة 1.055 كيلوجول ، وتساوي وحدة كوادريليون BTU (1 كوادريليون ) 1.055 إكساجول. ولأن وحدة BTU هي وحدة حرارية ، تُضرب المصادر التي تولد الكهرباء مباشرةً بمعامل تحويل لمعادلتها مع المصادر التي تستخدم محركًا حراريًا . [ 336 ]
كانت الولايات المتحدة ثاني أكبر منتج ومستهلك للطاقة في عام 2021 بعد الصين . [ 337 ] بلغ استهلاك الفرد من الطاقة في الولايات المتحدة 295 مليون وحدة حرارية بريطانية (311 جيجا جول)، مما جعلها تحتل المرتبة العاشرة عالميًا بعد كندا والنرويج والعديد من الدول العربية . [ 337 ]
كما هو الحال في دول أخرى، تمنح المنطقة الاقتصادية الخالصة التي تمتد لمسافة 200 ميل بحري (370 كم) قبالة سواحل الولايات المتحدة قطاع صيد الأسماك فيها حقوقًا خاصة. [ 338 ] وتغطي هذه المنطقة مساحة 11.4 مليون كيلومتر مربع (4.38 مليون ميل مربع)، ما يجعلها ثاني أكبر منطقة اقتصادية خالصة في العالم، متجاوزة مساحة الولايات المتحدة نفسها. [ 339 ]
بحسب منظمة الأغذية والزراعة (الفاو) ، في عام 2005، اصطادت الولايات المتحدة 4,888,621 طنًا من الأسماك من مصائد الأسماك البرية ، و471,958 طنًا أخرى من مزارع الأحياء المائية . وبذلك أصبحت الولايات المتحدة خامس أكبر منتج للأسماك، بعد الصين وبيرو والهند وإندونيسيا، بنسبة 3.8% من الإجمالي العالمي. [ 340 ]
بدأ التعدين في الولايات المتحدة منذ بداية الحقبة الاستعمارية، لكنه تحوّل إلى صناعة رئيسية في القرن التاسع عشر مع اكتشاف عدد من المعادن الجديدة التي أدت إلى سلسلة من موجات التنقيب. في عام 2015، بلغت قيمة الفحم والمعادن والمعادن الصناعية المستخرجة في الولايات المتحدة 109.6 مليار دولار أمريكي. وبلغ عدد العاملين في قطاع التعدين 158 ألف عامل . [ 341 ]
تُخلّف صناعة التعدين آثارًا عديدة على المجتمعات والأفراد والبيئة. وقد شكّلت حوادث السلامة في المناجم جزءًا هامًا من تاريخ السلامة والصحة المهنية في الولايات المتحدة . وللتعدين آثار بيئية عديدة، ففي الولايات المتحدة، تُخلّف قضايا مثل إزالة قمم الجبال وتصريف المياه الحمضية من المناجم آثارًا واسعة النطاق على جميع جوانب البيئة. وفي يناير 2020، أدرجت وكالة حماية البيئة الأمريكية 142 منجمًا ضمن برنامج "سوبرفند" . [ 342 ]
في عام 2019، كانت الدولة رابع أكبر منتج للذهب في العالم ؛ [ 343 ] وخامس أكبر منتج للنحاس في العالم ؛ [ 344 ] وخامس أكبر منتج للبلاتين في العالم ؛ [ 345 ] وعاشر أكبر منتج للفضة في العالم ؛ [ 346 ] وثاني أكبر منتج للرينيوم في العالم ؛ [ 347 ] وثاني أكبر منتج للكبريت في العالم ؛ [ 348 ] وثالث أكبر منتج للفوسفات في العالم ؛ [ 349 ] وثالث أكبر منتج للموليبدينوم في العالم ؛ [ 350 ] ورابع أكبر منتج للرصاص في العالم ؛ [ 351 ] ورابع أكبر منتج للزنك في العالم ؛ [ 352 ] وخامس أكبر منتج للفاناديوم في العالم ؛ [ 353 ] وتاسع أكبر منتج لخام الحديد في العالم ؛ [ 354 ] وتاسع أكبر منتج للبوتاس في العالم . [ 355 ] ثاني عشر أكبر منتج للكوبالت في العالم ؛ [ 356 ] ثالث عشر أكبر منتج للتيتانيوم في العالم ؛ [ 357 ] أكبر منتج للجبس في العالم ؛ [ 358 ] ثاني أكبر منتج للكيانيت في العالم ؛ [ 359 ] ثاني أكبر منتج للحجر الجيري في العالم ؛ [ 360 ] بالإضافة إلى كونها ثاني أكبر منتج للملح في العالم . [ 361 ] كانت عاشر أكبر منتج لليورانيوم في العالم عام 2018. [ 362 ]


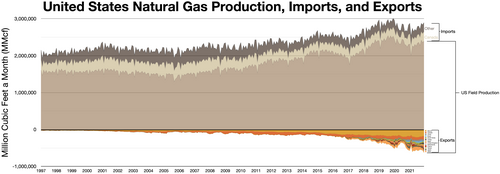


The United States is the largest producer of petroleum in the world.[363] Petroleum has been a major industry in the United States since the 1859 Pennsylvania oil rush around Titusville, Pennsylvania. Commonly characterized as "Big Oil", the industry includes exploration, production, refining, transportation, and marketing of oil and natural gas products.[364] The leading crude oil-producing areas in the United States in 2023 were Texas, followed by the offshore federal zone of the Gulf of Mexico, then North Dakota and New Mexico.[365]
The United States became the largest producer of crude oil of any nation in history in 2023.[363] Natural gas production reached record highs.[366] Employment in oil and gas extraction peaked at 267,000 in March 1982, and totaled 199,500 in March 2024.[367]
Despite petroleum's many uses from its large scale production, it comes with issues surrounding the environment and human health. Oil spills are a source of pollution and there is heavy water usage for oil production.[368] Use of petroleum products generates greenhouse gas emissions.
Secondary sectors
The United States is the world's second-largest manufacturer, with a 2013 industrial output of US$2.4 trillion. Its manufacturing output is greater than of Germany, France, India, and Brazil combined.[369] Its main industries include financials, information technology, petroleum, steel, automobiles, construction machinery, aerospace, agricultural machinery, telecommunications, chemicals, electronics, food processing, consumer goods, lumber, mining and armaments.
The U.S. leads the world in airplane manufacturing,[370] which represents a large portion of U.S. industrial output. American companies such as Boeing, Cessna (see: Textron), Lockheed Martin (see: Skunk Works), and General Dynamics produce a majority of the world's civilian and military aircraft in factories across the United States.
The manufacturing sector of the U.S. economy has experienced substantial job losses over the past several years.[371][372] In January 2004, the number of such jobs stood at 14.3 million, down by 3.0 million jobs (17.5%) since July 2000 and about 5.2 million since the historical peak in 1979. Employment in manufacturing was its lowest since July 1950.[373] The number of steel workers fell from 500,000 in 1980 to 224,000 in 2000.[374]

The U.S. produces approximately 18% of the world's manufacturing output, a share that has declined as other nations developed competitive manufacturing industries.[376] The job loss during this continual volume growth is the result of multiple factors including increased productivity, trade, and secular economic trends.[377] In addition, growth in telecommunications, pharmaceuticals, aircraft, heavy machinery and other industries along with declines in low end, low skill industries such as clothing, toys, and other simple manufacturing have resulted in some U.S. jobs being more highly skilled and better paying. There has been much debate within the United States on whether the decline in manufacturing jobs are related to American unions, lower foreign wages, or both.[378][379][380]
Tertiary sectors

Transportation
Road
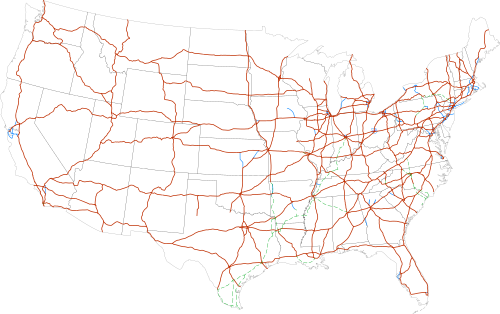
يعتمد الاقتصاد الأمريكي بشكل كبير على النقل البري لنقل الأفراد والبضائع. تهيمن السيارات على وسائل النقل الشخصية، حيث تعمل على شبكة طرق عامة تمتد لأربعة ملايين ميل (6.4 مليون كيلومتر)، [ 382 ] بما في ذلك واحدة من أطول شبكات الطرق السريعة في العالم بطول 57,000 ميل (91,700 كيلومتر). [ 383 ] وباعتبارها ثاني أكبر سوق للسيارات في العالم، [ 384 ] تتمتع الولايات المتحدة بأعلى معدل لملكية السيارات للفرد في العالم، حيث يبلغ 765 سيارة لكل 1000 أمريكي. [ 385 ] حوالي 40% من المركبات الشخصية هي شاحنات صغيرة أو سيارات دفع رباعي أو شاحنات خفيفة. [ 386 ]
السكك الحديدية
تُشكّل وسائل النقل العام 9% من إجمالي رحلات العمل في الولايات المتحدة . [ 387 ] [ 388 ] يُعدّ نقل البضائع بالسكك الحديدية واسع النطاق، على الرغم من أن عدد الركاب الذين يستخدمون السكك الحديدية بين المدن للسفر لا يزال منخفضًا نسبيًا (حوالي 31 مليون راكب سنويًا)، ويعود ذلك جزئيًا إلى انخفاض الكثافة السكانية في معظم أنحاء البلاد. [ 389 ] [ 390 ] ومع ذلك، فقد ارتفع عدد ركاب شركة أمتراك ، وهي نظام السكك الحديدية الوطني لنقل الركاب بين المدن، بنسبة 37% تقريبًا بين عامي 2000 و2010. [ 391 ] كما ازداد تطوير السكك الحديدية الخفيفة في السنوات الأخيرة. [ 392 ] وتقوم ولاية كاليفورنيا حاليًا بإنشاء أول نظام سكك حديدية فائق السرعة في البلاد .
شركة طيران


قطاع الطيران المدني مملوك بالكامل للقطاع الخاص، وقد تم تحريره إلى حد كبير منذ عام 1978 ، بينما معظم المطارات الرئيسية مملوكة للدولة. [ 393 ] أكبر ثلاث شركات طيران في العالم من حيث عدد الركاب هي شركات أمريكية؛ وتتصدر الخطوط الجوية الأمريكية القائمة بعد استحواذ شركة يو إس إيرويز عليها عام 2013. [ 394 ] من بين أكثر ثلاثين مطارًا ازدحامًا في العالم، اثنا عشر مطارًا تقع في الولايات المتحدة، بما في ذلك مطار هارتسفيلد-جاكسون الدولي في أتلانتا ، وهو الأكثر ازدحامًا . [ 395 ]
طاقة

The US is the second-largest energy consumer in total use.[396] The U.S. ranks seventh in energy consumption per capita after Canada and a number of other countries.[397][398] The majority of this energy is derived from fossil fuels: in 2005, it was estimated that 40% of the nation's energy came from petroleum, 23% from coal, and 23% from natural gas. Nuclear power supplied 8.4% and renewable energy supplied 6.8%, which was mainly from hydroelectric dams although other renewables are included.[399]
American dependence on oil imports grew from 24% in 1970 to 65% by the end of 2005.[400]Transportation has the highest consumption rates, accounting for approximately 69% of the oil used in the United States in 2006,[401] and 55% of oil use worldwide as documented in the Hirsch report.
In 2013, the United States imported 2.808 billion barrels of crude oil, compared to 3.377 billion barrels in 2010.[402] While the U.S. is the largest importer of fuel, The Wall Street Journal reported in 2011 that the country was about to become a net fuel exporter for the first time in 62 years. The paper reported expectations that this would continue until 2020.[403] In fact, petroleum was the major export from the country in 2011.[404]
Telecommunications
The Internet was developed in the U.S. and the country hosts many of the world's largest hubs.[405]
Tourism


In the United States, tourism is a large industry that serves millions of international and domestic tourists yearly. Foreigners visit the U.S. to see natural wonders, cities, historic landmarks, and entertainment venues. Americans seek similar attractions, as well as recreation and vacation areas.
شهدت السياحة في الولايات المتحدة نموًا سريعًا، لا سيما السياحة الحضرية، خلال أواخر القرن التاسع عشر وأوائل القرن العشرين. وبحلول خمسينيات القرن التاسع عشر، كانت السياحة في الولايات المتحدة قد ترسخت كنشاط ثقافي وصناعة على حد سواء. وقد استقطبت مدن نيويورك ، ولوس أنجلوس ، وشيكاغو ، وبوسطن ، وفيلادلفيا ، وواشنطن العاصمة ، وسان فرانسيسكو ، وهي جميعها مدن أمريكية رئيسية، أعدادًا كبيرة من السياح منذ تسعينيات القرن التاسع عشر. وبحلول عام ١٩١٥، أحدثت الجولات السياحية في المدن تحولاتٍ جوهرية في طريقة إدراك الأمريكيين للمدينة، وتنظيمهم لرحلاتهم، وتنقلهم فيها.
خلال أوائل القرن العشرين، ازداد عدد المسافرين بشكل ملحوظ، ويعود ذلك جزئياً إلى انتشار السيارات. وبالمثل، أحدث السفر الجوي ثورة في عالم السفر خلال الفترة من 1945 إلى 1969، مساهماً بشكل كبير في ازدهار السياحة في الولايات المتحدة. وبلغت مشتريات السلع والخدمات المتعلقة بالسفر والسياحة من قبل الزوار الدوليين الذين سافروا إلى الولايات المتحدة 10.9 مليار دولار أمريكي خلال شهر فبراير 2013. [ 406 ]
في الولايات المتحدة، يُعدّ قطاع السياحة من بين أكبر ثلاثة قطاعات توظيف في 29 ولاية، حيث وظّف 7.3 مليون شخص عام 2004، لتلبية احتياجات 1.19 مليار رحلة سياحية في الولايات المتحدة عام 2005. واعتبارًا من عام 2007، بلغ عدد المعالم التاريخية الوطنية المسجلة والمعترف بها من قبل حكومة الولايات المتحدة 2462 معلمًا . واعتبارًا من عام 2023، تُعدّ مدينة نيويورك الوجهة السياحية الأكثر زيارة في الولايات المتحدة، تليها ميامي ، ولوس أنجلوس ، وأورلاندو ، وسان فرانسيسكو . [ 407 ]
ينفق السياح في الولايات المتحدة أموالاً أكثر من أي دولة أخرى، لكن الولايات المتحدة لا تجذب سوى ثالث أكبر عدد من السياح، بعد فرنسا وإسبانيا . [ 408 ] [ 409 ] وقد يُعزى هذا التباين إلى طول مدة الإقامة في الولايات المتحدة. [ 409 ]
التجارة الدولية


يلعب الاقتصاد الأمريكي دورًا محوريًا في التجارة العالمية، إذ يُعد ثاني أكبر مُصدِّر، وأكبر مُستورد، وأكبر مُتاجر بالخدمات اعتبارًا من عام 2025. [ 411 ] [ 412 ] ويُتداول الدولار الأمريكي بكميات كبيرة في جميع أنحاء العالم؛ إذ يُشكِّل حوالي 60% من الأموال المُستخدمة في التجارة الدولية. كما يُستخدم الدولار كوحدة العملة القياسية في الأسواق الدولية للسلع الأساسية كالذهب والنفط. [ 413 ]
أنشأت اتفاقية التجارة الحرة لأمريكا الشمالية ، أو نافتا ، واحدة من أكبر التكتلات التجارية في العالم في عام 1994. [ 414 ] [ 415 ]
منذ عام 1976، تعاني الولايات المتحدة من عجز في الميزان التجاري السلعي مع الدول الأخرى، ومنذ عام 1982، من عجز في الحساب الجاري . ومع ذلك، حافظت البلاد على فائضها طويل الأمد في تجارة الخدمات ، وبلغ رقماً قياسياً قدره 231 مليار دولار أمريكي في عام 2013. [ 416 ]
ارتفع العجز التجاري الأمريكي من 502 مليار دولار في عام 2016 إلى 552 مليار دولار في عام 2017، بزيادة قدرها 50 مليار دولار أو 10%. [ 417 ] وخلال عام 2017، بلغ إجمالي الواردات 2.90 تريليون دولار، بينما بلغت الصادرات 2.35 تريليون دولار. وبلغ صافي العجز في السلع 807 مليارات دولار، في حين بلغ صافي الفائض في الخدمات 255 مليار دولار. [ 418 ]
أكبر عشرة شركاء تجاريين للأمريكتين هم الصين، وكندا، والمكسيك، واليابان، وألمانيا، وكوريا الجنوبية، والمملكة المتحدة، وفرنسا، والهند، وتايوان. [ 46 ] ارتفع العجز التجاري في السلع مع الصين من 347 مليار دولار في عام 2016 إلى 376 مليار دولار في عام 2017، بزيادة قدرها 30 مليار دولار أو 8%. وفي عام 2017، بلغ العجز التجاري في السلع للولايات المتحدة 71 مليار دولار مع المكسيك و17 مليار دولار مع كندا. [ 419 ]
بحسب مؤشر KOF للعولمة ومؤشر العولمة الصادر عن شركة AT Kearney/مجلة السياسة الخارجية، تتمتع الولايات المتحدة بدرجة عالية نسبياً من العولمة . ويرسل العمال الأمريكيون ثلث إجمالي التحويلات المالية في العالم. [ 420 ]
| ميزان التجارة لعام 2014 (السلع فقط) [ 421 ] | |||||||||
|---|---|---|---|---|---|---|---|---|---|
| الصين | منطقة اليورو | اليابان | المكسيك | المحيط الهادئ | كندا | الشرق الأوسط | أمريكا اللاتينية | إجمالي المنتج | |
| حاسوب | -151.9 | 3.4 | -8.0 | -11.0 | -26.1 | 20.9 | 5.8 | 12.1 | -155.0 |
| النفط والغاز والمعادن | 1.9 | 6.4 | 2.4 | -20.8 | 1.1 | -79.8 | -45.1 | -15.9 | -149.7 |
| مواصلات | 10.9 | -30.9 | -46.2 | -59.5 | -0.5 | -6.1 | 17.1 | 8.8 | -106.3 |
| ملابس | -56.3 | -4.9 | 0.6 | -4.2 | -6.3 | 2.5 | -0.3 | -1.1 | -69.9 |
| المعدات الكهربائية | -35.9 | -2.4 | -4.0 | -8.5 | -3.3 | 10.0 | 1.8 | 2.0 | -40.4 |
| تصنيع متنوع | -35.3 | 4.9 | 2.7 | -2.8 | -1.4 | 5.8 | -1.5 | 1.8 | -25.8 |
| أثاث | -18.3 | -1.2 | 0.0 | -1.6 | -2.1 | 0.4 | 0.2 | 0.0 | -22.6 |
| الآلات | -19.9 | -27.0 | -18.8 | 3.9 | 7.6 | 18.1 | 4.5 | 9.1 | -22.4 |
| المعادن الأولية | -3.1 | 3.1 | -1.8 | 1.0 | 1.9 | -8.9 | -0.9 | -10.4 | -19.1 |
| المعادن المصنعة | -17.9 | -5.9 | -3.5 | 2.8 | -4.3 | 7.3 | 1.2 | 1.9 | -18.5 |
| البلاستيك | -15.7 | -1.9 | -2.0 | 5.7 | -4.1 | 2.6 | -0.1 | 0.5 | -15.0 |
| النسيج | -12.3 | -1.1 | -0.3 | 2.8 | -4.6 | 1.5 | -0.9 | 0.2 | -14.7 |
| المشروبات، التبغ | 1.3 | -9.9 | 0.6 | -3.3 | 0.0 | 1.0 | 0.2 | -0.6 | -10.6 |
| المعادن غير المعدنية | -6.1 | -1.9 | -0.4 | -1.2 | 0.1 | 1.9 | -0.5 | -0.8 | -8.9 |
| ورق | -2.7 | 1.2 | 1.1 | 4.3 | 1.2 | -9.8 | 0.9 | -1.9 | -5.8 |
| المواد الكيميائية | -3.9 | -39.5 | -1.5 | 19.1 | 3.2 | 4.6 | -2.4 | 15.8 | -4.7 |
| طعام | 0.7 | -3.6 | 6.1 | 4.9 | 0.9 | 0.1 | 1.4 | -1.1 | 9.5 |
| زراعة | 17.8 | 6.2 | 7.3 | -3.0 | 5.7 | -0.8 | 2.8 | -6.5 | 29.5 |
| البترول | 0.6 | -1.2 | 0.1 | 16.6 | -2.0 | -0.1 | 0.6 | 18.3 | 32.9 |
| الإجمالي حسب البلد/المنطقة | -346.1 | -106.1 | -65.6 | -54.9 | -33.0 | -29.0 | -15.1 | 32.3 | |
الوضع المالي

The U.S. public debt was $909 billion in 1980, an amount equal to 33% of America's gross domestic product (GDP); by 1990, that number had more than tripled to $3.2 trillion –56% of GDP.[422] In 2001 the national debt was $5.7 trillion; however, the debt-to-GDP ratio remained at 1990 levels.[423] Debt levels rose quickly in the following decade, and on January 28, 2010, the U.S. debt ceiling was raised to $14.3 trillion.[424] Based on the 2010 United States federal budget, total national debt will grow to nearly 100% of GDP, versus a level of approximately 80% in early 2009.[425] The White House estimates that the government's tab for servicing the debt will exceed $700 billion a year in 2019,[426] up from $202 billion in 2009.[427]
U.S. household and non-profit net worth exceeded $100 trillion for the first time in Q1 2018; it has been setting records since Q4 2012.[428] The U.S. federal government or "national debt" was $21.1 trillion in May 2018, just over 100% GDP.[429] Using a subset of the national debt called "debt held by the public", U.S. debt was approximately 77% GDP in 2017. By this measure, the U.S. ranked 43rd highest among 2017 nations.[430] Debt held by the public rose considerably as a result of the Great Recession and its aftermath. It is expected to continue rising as the country ages towards 100% GDP by 2028.[431] In February 2024, the total federal government debt grew to $34.4 trillion after having grown by approximately $1 trillion in both of two separate 100-day periods since the previous June.[432]
The U.S. Treasury statistics indicate that, at the end of 2006, non-US citizens and institutions held 44% of federal debt held by the public.[433]As of 2014, China, holding $1.26 trillion in treasury bonds, is the largest foreign financier of the U.S. public debt.[434]
يشمل الوضع المالي العام للولايات المتحدة في عام 2014 أصولاً بقيمة 269.6 تريليون دولار أمريكي مملوكة للأسر والشركات والحكومات داخل حدودها، وهو ما يمثل أكثر من 15.7 ضعف الناتج المحلي الإجمالي السنوي للولايات المتحدة. وبلغت الديون المستحقة خلال الفترة نفسها 145.8 تريليون دولار أمريكي، أي ما يعادل 8.5 ضعف الناتج المحلي الإجمالي السنوي تقريباً. [ 435 ] [ 436 ]
منذ عام 2010، حصلت وزارة الخزانة الأمريكية على معدلات فائدة حقيقية سلبية على ديونها الحكومية. [ 437 ] وتحدث هذه المعدلات المنخفضة، التي يتجاوزها معدل التضخم ، عندما يعتقد السوق أنه لا توجد بدائل ذات مخاطر منخفضة بما فيه الكفاية، أو عندما تضطر المؤسسات الاستثمارية الشائعة، مثل شركات التأمين والمعاشات التقاعدية وصناديق السندات وأسواق المال والصناديق المشتركة المتوازنة، إلى استثمار مبالغ كبيرة في سندات الخزانة للتحوط من المخاطر، أو عندما تختار ذلك. [ 438 ] [ 439 ] ويجادل الخبير الاقتصادي الأمريكي لورانس سامرز بأن اقتراض الدين الحكومي بهذه المعدلات المنخفضة يوفر أموال دافعي الضرائب، ويحسن الجدارة الائتمانية. [ 440 ]
في أواخر الأربعينيات وحتى أوائل السبعينيات، خفّضت كل من الولايات المتحدة والمملكة المتحدة عبء ديونهما بنحو 30% إلى 40% من الناتج المحلي الإجمالي لكل عقد، وذلك بالاستفادة من أسعار الفائدة الحقيقية السلبية، ولكن لا يوجد ما يضمن استمرار انخفاض أسعار الفائدة على الدين الحكومي إلى هذا الحد. [ 438 ] [ 441 ] في يناير 2012، أوصت اللجنة الاستشارية للاقتراض التابعة لوزارة الخزانة الأمريكية، والمنضوية تحت لواء رابطة صناعة الأوراق المالية والأسواق المالية، بالإجماع بالسماح ببيع الدين الحكومي في مزادات بأسعار فائدة أقل، تصل إلى أسعار فائدة مطلقة سلبية. [ 442 ]
انخفض مؤشر ثقة المستهلك إلى 88.7 في نوفمبر 2025، وهو انخفاض ملحوظ عن الشهر السابق. ويعزى هذا الانخفاض إلى المخاوف بشأن استقرار التوظيف، وارتفاع التضخم، والأمن المالي، والتوترات التجارية، وعدم الاستقرار السياسي. [ 443 ]
العملة والبنك المركزي

الدولار الأمريكي هو العملة الرسمية للولايات المتحدة الأمريكية. وهو العملة الأكثر استخدامًا في المعاملات الدولية. [ 444 ] تستخدمه عدة دول كعملة رسمية ، وفي دول أخرى كثيرة يُعد العملة المتداولة بحكم الأمر الواقع . [ 445 ]
تسعى الحكومة الفيدرالية إلى استخدام كلٍّ من السياسة النقدية (التحكم في المعروض النقدي من خلال آليات مثل تغيير أسعار الفائدة) والسياسة المالية (الضرائب والإنفاق) للحفاظ على انخفاض التضخم، وارتفاع النمو الاقتصادي، وانخفاض البطالة. وقد تأسس بنك مركزي مستقل ، يُعرف باسم الاحتياطي الفيدرالي ، عام ١٩١٣ لتوفير عملة مستقرة وسياسة نقدية فعّالة. ويُعتبر الدولار الأمريكي من أكثر العملات استقرارًا في العالم، وتدعم العديد من الدول عملاتها باحتياطيات من الدولار الأمريكي. [ ٤٣ ] [ ٤٤٦ ]
حافظ الدولار الأمريكي على مكانته كعملة الاحتياط الرئيسية في العالم، رغم أنه يواجه تحديات تدريجية في هذا الدور. [ 447 ] يُحتفظ بما يقرب من ثلثي احتياطيات العملات الأجنبية حول العالم بالدولار الأمريكي، مقارنةً بنحو 25% للعملة التالية الأكثر شيوعًا، وهي اليورو . [ 448 ] وقد دفع ارتفاع الدين الوطني الأمريكي والتيسير الكمي البعض إلى التنبؤ بأن الدولار الأمريكي سيفقد مكانته كعملة الاحتياط العالمية؛ إلا أن هذه التوقعات لم تتحقق بعد. [ 449 ]
تغير المناخ

يُشير التقييم الوطني الخامس للمناخ إلى أن تغير المناخ يؤثر على المجتمعات في جميع أنحاء الولايات المتحدة، وتختلف هذه التأثيرات من ولاية إلى أخرى. وتُعدّ الخسائر البشرية والاقتصادية فادحة. وبات بإمكان العلماء الآن تحديد مدى تأثير تغير المناخ على حدث مناخي مُحدد بثقة عالية نسبيًا. وتشمل التأثيرات المذكورة في التقرير زيادة تواتر وشدة موجات الحر والجفاف والفيضانات والأعاصير وغيرها . [ 450 ]
An article in Science predicts that the Southern states, such as Texas, Florida, and the Deep South will be economically affected by climate change more severely than northern states (some of which would even gain benefits), but that economic impacts of climate change would likely exacerbate preexisting economic inequality in the country.[451][452] In September 2020, a subcommittee of the Commodity Futures Trading Commission issued a report that concluded that climate change poses systemic risks to the U.S. financial system,[453][454][455] while the Financial Stability Oversight Council released a report in October 2021 that identified climate change as an emerging and increasing threat to the stability of the U.S. financial system.[456][457][458]
A 2021 survey of 1,422 members of the American Economic Association found that 86 percent of professional economists generally agreed with the statement: "Climate change poses a major risk to the US economy."[459][460] In September 2023, the U.S. Treasury Department issued a report in consultation with the Financial Literacy and Education Commission found that 13% of Americans experienced financial hardship in 2022 due to the effects of climate change after $176 billion in weather disasters.[461][462][463] In April 2024, Consumer Reports announced the release of a report commissioned from ICF International that estimated that climate change could cost Americans born in 2024 nearly $500,000 over their lifetimes.[464][465][466]
A 2026 study published in Nature estimated that, from 1990 through 2020, carbon dioxide emissions in the US caused $10.2 trillion in cumulative damages by 2020, with about 30% occurring within the US itself.[467] The researchers said that future damages from past emissions are at least an order of magnitude larger than historical damages from the same emissions.[467]
Corruption
في عام 2019، احتلت الولايات المتحدة المرتبة 23 في مؤشر مدركات الفساد لمنظمة الشفافية الدولية، حيث حصلت على 69 نقطة من أصل 100. [ 468 ] ويمثل هذا انخفاضاً عن نتيجتها في عام 2018 التي بلغت 71 نقطة من أصل 100. [ 469 ]
القانون والحكومة
احتلت الولايات المتحدة المرتبة الرابعة في مؤشر سهولة ممارسة الأعمال التجارية في عام 2012، والمرتبة الثامنة عشرة في مؤشر الحرية الاقتصادية في العالم الصادر عن معهد فريزر في عام 2012، والمرتبة العاشرة في مؤشر الحرية الاقتصادية الصادر عن صحيفة وول ستريت جورنال ومؤسسة التراث في عام 2012، والمرتبة الخامسة عشرة في تقرير تمكين التجارة العالمية لعام 2014 ، [ 470 ] والمرتبة الثالثة في تقرير التنافسية العالمية . [ 471 ]
بحسب مؤشر الحرية الاقتصادية لعام 2014 ، الصادر عن صحيفة وول ستريت جورنال ومؤسسة التراث ، خرجت الولايات المتحدة من قائمة الدول العشر الأكثر حرية اقتصادية. وتشهد الولايات المتحدة تراجعًا مطردًا في الحرية الاقتصادية على مدى سبع سنوات، وهي الدولة الوحيدة التي تحقق هذا التراجع. [ 472 ] يقيس المؤشر مدى التزام كل دولة بنظام السوق الحر على مقياس من 0 إلى 100. وتواجه الدول التي تفقد حريتها الاقتصادية وتحصل على درجات منخفضة في المؤشر خطر الركود الاقتصادي، وارتفاع معدلات البطالة، وتدهور الأوضاع الاجتماعية. [ 473 ] [ 474 ] وقد منح مؤشر الحرية الاقتصادية لعام 2014 الولايات المتحدة درجة 75.5، لتحتل بذلك المرتبة الثانية عشرة عالميًا من حيث الحرية الاقتصادية. وقد تراجعت الولايات المتحدة مركزين، وأصبحت درجتها أقل بنصف نقطة عن عام 2013. [ 472 ]
ينتقد الخبير الاقتصادي آلان بليندر تنظيم الحكومة الديمقراطية للاقتصاد الأمريكي باعتباره قصير النظر للغاية (إذ يركز إما على الانتخابات القادمة أو على دورة الأخبار القادمة بدلاً من اتخاذ خيارات صعبة تُفضّل الفوائد طويلة الأجل على الرغم من الألم قصير الأجل)، ويُفضّل السياسات التي تبدو جيدة ويتجنب تلك التي تبدو سيئة، بغض النظر عن جدارتها عند فحصها بدقة من قبل الاقتصاديين. [ 475 ]
أنظمة
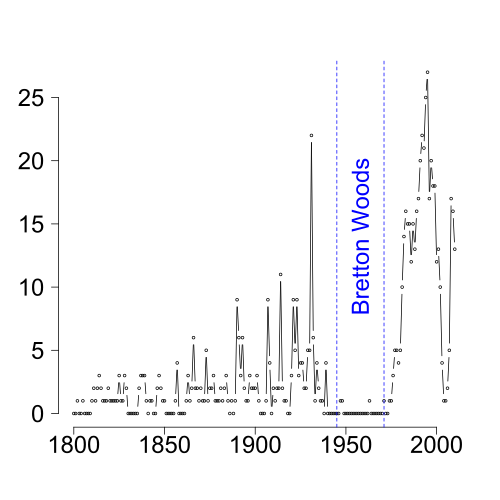
The U.S. federal government regulates private enterprise in numerous ways. Regulation falls into two general categories.
Some efforts seek, either directly or indirectly, to control prices. Traditionally, the government has sought to create state-regulated monopolies such as electric utilities while allowing prices in the level that would ensure them normal profits. At times, the government has extended economic control to other kinds of industries as well. In the years following the Great Depression, it devised a complex system to stabilize prices for agricultural goods, which tend to fluctuate wildly in response to rapidly changing supply and demand. A number of other industries—trucking and, later, airlines—successfully sought regulation themselves to limit what they considered as harmful price-cutting, a process called regulatory capture.[477]
Another form of economic regulation, antitrust law, seeks to strengthen market forces so that direct regulation is unnecessary. The government—and, sometimes, private parties—have used antitrust law to prohibit practices or mergers that would unduly limit competition.[477]
Bank regulation in the United States is highly fragmented compared to other G10 countries where most countries have only one bank regulator. In the U.S., banking is regulated at both the federal and state level. The U.S. also has one of the most highly regulated banking environments in the world; however, many of the regulations are not soundness related, but are instead focused on privacy, disclosure, fraud prevention, anti-money laundering, anti-terrorism, anti-usury lending, and promoting lending to lower-income segments.
منذ سبعينيات القرن الماضي، مارست الحكومات أيضاً رقابة على الشركات الخاصة لتحقيق أهداف اجتماعية، مثل تحسين صحة وسلامة الجمهور أو الحفاظ على بيئة صحية. فعلى سبيل المثال، تضع إدارة السلامة والصحة المهنية معايير السلامة في مكان العمل وتفرض تطبيقها، بينما تضع وكالة حماية البيئة الأمريكية معايير ولوائح للحفاظ على موارد الهواء والماء والأرض. أما إدارة الغذاء والدواء الأمريكية فتنظم الأدوية المسموح بطرحها في السوق، كما تضع معايير الإفصاح عن مكونات المنتجات الغذائية. [ 477 ]
شهدت المواقف الأمريكية تجاه التنظيم الاقتصادي تغيرات جوهرية خلال العقود الثلاثة الأخيرة من القرن العشرين. فابتداءً من سبعينيات القرن الماضي، ازداد اقتناع صانعي السياسات بأن التنظيم الاقتصادي يحمي الشركات على حساب المستهلكين في قطاعات مثل الطيران والنقل بالشاحنات. وفي الوقت نفسه، أدت التغيرات التكنولوجية إلى ظهور منافسين جدد في بعض القطاعات، مثل الاتصالات، التي كانت تُعتبر في السابق احتكارات طبيعية. وقد أفضى هذان التطوران إلى سلسلة من القوانين التي خففت من القيود التنظيمية. [ 477 ]
بينما أيّد قادة الحزبين السياسيين الأكثر نفوذاً في أمريكا عموماً تحرير الاقتصاد خلال سبعينيات وثمانينيات وتسعينيات القرن العشرين، كان هناك تباين في الآراء حول اللوائح المصممة لتحقيق أهداف اجتماعية. وقد اكتسب التنظيم الاجتماعي أهمية متزايدة في السنوات التي أعقبت الكساد الكبير والحرب العالمية الثانية، ثم مجدداً في ستينيات وسبعينيات القرن العشرين. وخلال ثمانينيات القرن العشرين، خففت الحكومة القيود المفروضة على العمل وحماية المستهلك والبيئة ، انطلاقاً من فكرة أن هذا التنظيم يعيق حرية التجارة ، ويزيد من تكاليف ممارسة الأعمال، وبالتالي يساهم في التضخم. وكانت ردود الفعل على هذه التغييرات متباينة؛ إذ استمر العديد من الأمريكيين في التعبير عن مخاوفهم بشأن أحداث أو اتجاهات محددة، مما دفع الحكومة إلى إصدار لوائح جديدة في بعض المجالات، بما في ذلك حماية البيئة. [ 477 ]
عندما لم تستجب القنوات التشريعية، لجأ بعض المواطنين إلى المحاكم لمعالجة القضايا الاجتماعية بشكل أسرع. فعلى سبيل المثال، في تسعينيات القرن الماضي، رفع أفراد، ثم الحكومة نفسها، دعاوى قضائية ضد شركات التبغ بسبب المخاطر الصحية لتدخين السجائر. وقد نصّت اتفاقية التسوية الرئيسية للتبغ لعام 1998 على تقديم مدفوعات طويلة الأجل للولايات لتغطية التكاليف الطبية لعلاج الأمراض المرتبطة بالتدخين. [ 477 ]
شهدت الولايات المتحدة، بين عامي 2000 و2008، أسرع توسع في التنظيم الاقتصادي منذ أوائل سبعينيات القرن الماضي. فقد ارتفع عدد الصفحات الجديدة في السجل الفيدرالي، الذي يُعد مؤشراً على التنظيم الاقتصادي، من 64,438 صفحة جديدة في عام 2001 إلى 78,090 صفحة جديدة في عام 2007، وهو رقم قياسي في حجم التنظيم. كما زادت اللوائح ذات الأهمية الاقتصادية، والتي تُعرَّف بأنها اللوائح التي تتجاوز تكلفتها 100 مليون دولار سنوياً، بنسبة 70%. وارتفع الإنفاق على التنظيم بنسبة 62%، من 26.4 مليار دولار إلى 42.7 مليار دولار. [ 478 ]
الضرائب


يُعدّ نظام الضرائب في الولايات المتحدة نظامًا معقدًا قد يشمل دفع الضرائب لأربعة مستويات حكومية مختلفة على الأقل، بالإضافة إلى العديد من أساليب فرض الضرائب. تُفرض الضرائب من قِبل الحكومة الفيدرالية ، وحكومات الولايات ، وغالبًا من قِبل الحكومات المحلية ، والتي قد تشمل المقاطعات ، والبلديات، والمدن ، والمناطق التعليمية ، وغيرها من المناطق ذات الأغراض الخاصة ، مثل مناطق الإطفاء، والمرافق العامة، والنقل العام. [ 479 ]
تشمل أشكال الضرائب الضرائب على الدخل ، والممتلكات ، والمبيعات ، والواردات، والرواتب، والتركات، والهبات، بالإضافة إلى رسوم متنوعة. وعند أخذ الضرائب المفروضة على جميع المستويات الحكومية في الاعتبار، بلغ إجمالي الضرائب كنسبة مئوية من الناتج المحلي الإجمالي حوالي ربع الناتج المحلي الإجمالي في عام 2011. [ 480 ] وتُعد حصة السوق السوداء في الاقتصاد الأمريكي منخفضة للغاية مقارنةً بالدول الأخرى. [ 481 ]
على الرغم من أن دستور الولايات المتحدة يحظر فرض ضريبة ثروة اتحادية إلا إذا تم توزيع الإيرادات على الولايات حسب عدد سكانها، فإن ضريبة الأملاك التي تفرضها حكومات الولايات والحكومات المحلية تُعد بمثابة ضريبة ثروة على العقارات ، ولأن الأرباح الرأسمالية تُفرض عليها ضريبة على أساس الأرباح الاسمية بدلاً من الأرباح المعدلة وفقًا للتضخم، فإن ضريبة الأرباح الرأسمالية تُعد بمثابة ضريبة ثروة على أساس معدل التضخم. [ 482 ]
يُعتبر النظام الضريبي الأمريكي تصاعديًا بشكل عام ، لا سيما على المستوى الفيدرالي، وهو من بين أكثر الأنظمة الضريبية تصاعدية في العالم المتقدم. [ 483 ] [ 484 ] [ 485 ] [ 486 ] وهناك جدل قائم حول ما إذا كان ينبغي أن تكون الضرائب أكثر أو أقل تصاعدية. [ 482 ] [ 487 ] [ 488 ] [ 489 ]
بحسب شبكة العدالة الضريبية في عام 2022، فإن الولايات المتحدة تساهم في تعزيز السرية المالية العالمية أكثر مما تساهم فيه سويسرا وجزر كايمان وبرمودا مجتمعة. [ 490 ]
الإنفاق

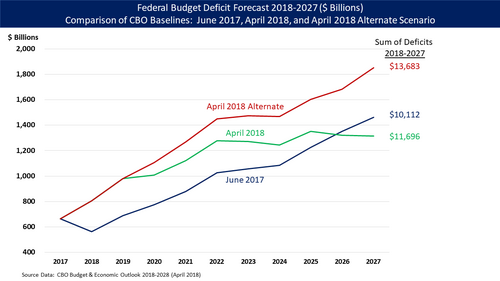
يُشكّل الإنفاق الحكومي في الولايات المتحدة حوالي 38% من الناتج المحلي الإجمالي (حوالي 21% للحكومة الفيدرالية، والباقي للولايات والمحليات). [ 492 ] وتُقدّم كل مستويات الحكومة العديد من الخدمات المباشرة. فعلى سبيل المثال، تتولى الحكومة الفيدرالية مسؤولية الدفاع الوطني، والبحوث التي غالبًا ما تُفضي إلى تطوير منتجات جديدة، واستكشاف الفضاء، وإدارة برامج عديدة تهدف إلى مساعدة العاملين على تطوير مهاراتهم المهنية وإيجاد فرص عمل (بما في ذلك التعليم العالي). ويُؤثّر الإنفاق الحكومي تأثيرًا كبيرًا على الاقتصادات المحلية والإقليمية، وعلى وتيرة النشاط الاقتصادي بشكل عام.
في الوقت نفسه، تتولى حكومات الولايات مسؤولية بناء وصيانة معظم الطرق السريعة. وتضطلع حكومات الولايات والمقاطعات والمدن بدورٍ رئيسي في تمويل وتشغيل المدارس العامة. أما الحكومات المحلية، فهي المسؤولة بالدرجة الأولى عن خدمات الشرطة والإطفاء. في عام 2016، بلغت ديون حكومات الولايات والحكومات المحلية الأمريكية 3 تريليونات دولار، ولديها التزامات غير ممولة أخرى بقيمة 5 تريليونات دولار. [ 493 ]
بدأ نظام الرعاية الاجتماعية في الولايات المتحدة في ثلاثينيات القرن العشرين، خلال فترة الكساد الكبير، مع إقرار برنامج الصفقة الجديدة . ثم توسع هذا النظام في ستينيات القرن العشرين من خلال تشريعات المجتمع العظيم ، والتي شملت برنامج الرعاية الطبية (Medicare) ، وبرنامج المساعدة الطبية ( Medicaid) ، وقانون كبار السن الأمريكيين ، والتمويل الفيدرالي للتعليم.
Overall, federal, state, and local spending accounted for almost 28% of gross domestic product in 1998.[494]
Federal budget and debt
During FY2017, the federal government spent $3.98 trillion on a budget or cash basis, up $128 billion or 3.3% vs. FY2016 spending of $3.85 trillion. Major categories of FY 2017 spending included: Healthcare such as Medicare and Medicaid ($1,077B or 27% of spending), Social Security ($939B or 24%), non-defense discretionary spending used to run federal Departments and Agencies ($610B or 15%), Defense Department ($590B or 15%), and interest ($263B or 7%).[491]
During FY2017, the federal government collected approximately $3.32 trillion in tax revenue, up $48 billion or 1.5% versus FY2016. Primary receipt categories included individual income taxes ($1,587 billion or 48% of total receipts), Social Security/Social Insurance taxes ($1,162 billion or 35%), and corporate taxes ($297 billion or 9%). Other revenue types included excise, estate and gift taxes. FY 2017 revenues were 17.3% of gross domestic product (GDP), versus 17.7% in FY 2016. Tax revenues averaged approximately 17.4% GDP over the 1980–2017 period.[491]
The federal budget deficit (i.e., expenses greater than revenues) was $665 billion in FY2017, versus $585 billion in 2016, an increase of $80 billion or 14%. The budget deficit was 3.5% GDP in 2017, versus 3.2% GDP in 2016. The budget deficit is forecast to rise to $804 billion in FY 2018, due significantly to the Tax Cuts and Jobs Act and other spending bills. An aging country and healthcare inflation are other drivers of deficits and debt over the long-run.[491]
Debt held by the public, a measure of national debt, was approximately $14.7 trillion or 77% of GDP in 2017, ranked the 43rd highest out of 207 countries.[495] This debt, as a percent of GDP, is roughly equivalent to those of many western European nations.[496]
Defense industry
The U.S. defense industry is the world's largest arms industry, valued at over $354 billion in 2026, driven by high-tech investments, geopolitical tensions and modernization efforts. Dominated by major firms like Lockheed Martin, RTX Corporation and Northrop Grumman, the sector is shifting toward autonomous systems, artificial intelligence and software-defined platforms. Key challenges include supply chain constraints, skilled labor shortages and rising regulatory compliance costs.[497]
Business culture
من السمات الأساسية للاقتصاد الأمريكي الحرية الاقتصادية الممنوحة للقطاع الخاص، والتي تسمح له باتخاذ غالبية القرارات الاقتصادية المتعلقة بتحديد اتجاه وحجم إنتاج الاقتصاد الأمريكي. ويتعزز ذلك بانخفاض مستويات التنظيم والتدخل الحكومي نسبيًا، [ 498 ] فضلًا عن نظام قضائي يحمي حقوق الملكية وينفذ العقود بشكل عام. اعتبارًا من عام 2025تضم الولايات المتحدة 36.2 مليون شركة صغيرة، وأربعين بالمئة من أصحاب الملايين في العالم، وثلاثين بالمئة من أصحاب المليارات في العالم، و138 شركة من بين أكبر 500 شركة في العالم. [ 499 ] [ 500 ] [ 501 ] [ 502 ]

منذ نشأتها كدولة مستقلة، شجعت الولايات المتحدة العلوم والابتكار. في أوائل القرن العشرين، نما البحث العلمي الذي تم تطويره من خلال التعاون غير الرسمي بين الصناعة الأمريكية والأوساط الأكاديمية نموًا سريعًا، وبحلول أواخر الثلاثينيات من القرن العشرين، تجاوز حجمه نظيره في بريطانيا (مع أن جودة البحث الأمريكي لم تكن آنذاك تضاهي جودة البحث البريطاني والألماني). بعد الحرب العالمية الثانية، لعب الإنفاق الفيدرالي على البحث والتطوير الدفاعي وسياسة مكافحة الاحتكار دورًا هامًا في الابتكار الأمريكي. [ 503 ]
تزخر الولايات المتحدة بالموارد المعدنية والتربة الزراعية الخصبة، وتتمتع بمناخ معتدل. كما تمتلك سواحل ممتدة على المحيطين الأطلسي والهادئ، بالإضافة إلى خليج المكسيك. وتتدفق الأنهار من مناطق بعيدة داخل القارة، وتوفر البحيرات العظمى (البحيرات الداخلية الخمس الكبيرة على طول الحدود الكندية) منافذ ملاحية إضافية. وقد ساهمت هذه الممرات المائية الواسعة في تشكيل النمو الاقتصادي للبلاد على مر السنين، وساعدت في توحيد الولايات الأمريكية الخمسين في وحدة اقتصادية واحدة. [ 504 ]
يُعدّ عدد العاملين، والأهم من ذلك إنتاجيتهم، من العوامل المهمة في تحديد صحة الاقتصاد الأمريكي. ارتفع الإنفاق الاستهلاكي في الولايات المتحدة إلى حوالي 62% من الناتج المحلي الإجمالي عام 1960، وظلّ عند هذا المستوى حتى عام 1981 تقريبًا، ثم ارتفع منذ ذلك الحين إلى 71% عام 2013. [ 72 ] وعلى مرّ تاريخها، شهدت الولايات المتحدة نموًا مطردًا في القوى العاملة، وهي ظاهرة تُعدّ سببًا ونتيجةً للتوسع الاقتصادي شبه الدائم. وحتى فترة وجيزة بعد الحرب العالمية الأولى، كان معظم العاملين من المهاجرين من أوروبا، أو أحفادهم المباشرين، أو الأمريكيين من أصل أفريقي الذين كانوا في الغالب عبيدًا جُلبوا من أفريقيا، أو أحفادهم. [ 505 ]
التحول الديموغرافي
Beginning in the late 20th century, many Latin Americans immigrated, followed by large numbers of Asians after the removal of nation-origin based immigration quotas.[506] The promise of high wages brings many highly skilled workers from around the world to the United States, as well as millions of undocumented immigrants seeking work in the informal economy. More than 13 million people officially entered the United States during the 1990s alone.[507]

Labor mobility has also been important to the capacity of the American economy to adapt to changing conditions. When labor markets on the East Coast received a major influx of immigrants, many workers moved inland, often to farmland waiting to be tilled. Similarly, economic opportunities in industrial, northern cities attracted Black Americans from southern farms in the first half of the 20th century, in what was known as the Great Migration.
In the United States, the corporation has emerged as an association of owners, known as stockholders, who form a business enterprise governed by a complex set of rules and customs. Brought on by the process of mass production, corporations, such as General Electric, have been instrumental in shaping the United States. Today in the era of globalization, American investors and corporations have influence all over the world. The American government is also included among the major investors in the American economy. Government investments have been directed towards public works of scale (such as from the Hoover Dam), military-industrial contracts, and the financial industry.
Aging
يشهد سكان الولايات المتحدة شيخوخة متزايدة ، مما له آثار اقتصادية بالغة على نمو الناتج المحلي الإجمالي، والإنتاجية، والابتكار، وعدم المساواة، والدين الوطني، وفقًا لعدة دراسات. بلغ متوسط عمر العامل في عام 2019 نحو 42 عامًا، مقابل 38 عامًا في عام 2000. وبحلول عام 2030، سيشكل البالغون فوق سن 16 عامًا حوالي 59% من القوى العاملة، مقابل 62% في عام 2015. وقدّرت إحدى الدراسات أن الشيخوخة منذ عام 2000 قد خفضت الإنتاجية بنسبة تتراوح بين 0.25% و0.7% سنويًا. وبما أن نمو الناتج المحلي الإجمالي يعتمد على الإنتاجية (الناتج لكل عامل) وعدد العمال، فإن كلا الاتجاهين يبطئان معدل نمو الناتج المحلي الإجمالي. كما أن زيادة مدخرات العمال الأكبر سنًا تدفع أسعار الفائدة نحو الانخفاض، مما يعوض جزءًا من انخفاض نمو الناتج المحلي الإجمالي، ولكنه يقلل من قدرة الاحتياطي الفيدرالي على معالجة الركود الاقتصادي عن طريق خفض أسعار الفائدة. تشمل وسائل معالجة ظاهرة الشيخوخة الهجرة (التي قد تجلب عمالاً أصغر سناً) وارتفاع معدلات الخصوبة، والتي يمكن تشجيعها من خلال حوافز لإنجاب المزيد من الأطفال (مثل الإعفاءات الضريبية، والإعانات، وإجازات مدفوعة الأجر أكثر سخاءً). [ 508 ]
قدّر مكتب الميزانية في الكونغرس في مايو 2019 أن الإنفاق الإلزامي (مثل برامج الرعاية الصحية لكبار السن، وبرامج المساعدة الطبية لكبار السن، والضمان الاجتماعي) سيستمر في النمو نسبةً إلى حجم الاقتصاد (الناتج المحلي الإجمالي) مع تقدم السكان في السن. ومن المتوقع أن يرتفع عدد السكان الذين تبلغ أعمارهم 65 عامًا فأكثر بمقدار الثلث خلال الفترة من 2019 إلى 2029. وبلغ الإنفاق الإلزامي على البرامج (النفقات) في عام 2019 نسبة 12.7% من الناتج المحلي الإجمالي، ومن المتوقع أن يبلغ متوسطه 14.4% من الناتج المحلي الإجمالي خلال الفترة من 2025 إلى 2029. [ 509 ]
ريادة الأعمال

تُعدّ الولايات المتحدة رائدةً في الابتكار التكنولوجي منذ أواخر القرن التاسع عشر، وفي البحث العلمي منذ منتصف القرن العشرين. ففي عام ١٨٧٦، مُنح ألكسندر غراهام بيل أول براءة اختراع أمريكية للهاتف . وطوّر مختبر توماس إديسون الفونوغراف ، وأول مصباح كهربائي طويل الأمد ، وأول كاميرا سينمائية عملية . كما كانت شركة إديسون رائدةً في مجال توصيل الطاقة الكهربائية ( التيار المستمر ) وتسويقها في جميع أنحاء العالم، وتبعتها شركات مثل شركة وستنجهاوس إلكتريك التي طوّرت بسرعة توصيل الطاقة بالتيار المتردد . وفي أوائل القرن العشرين، ساهمت شركتا السيارات التابعتان لرانسوم إي. أولدز وهنري فورد في نشر خط التجميع . وفي عام ١٩٠٣، حقق الأخوان رايت أول رحلة طيران مستدامة ومتحكم بها لطائرة أثقل من الهواء . [ ٥١٠ ]

يُولي المجتمع الأمريكي أهمية بالغة لريادة الأعمال والابتكار التجاري، لما لهما من دور في تعزيز الحيوية الاقتصادية . وتُعرَّف ريادة الأعمال بأنها "الشخص الذي يُوظِّف الابتكارات والتمويل والفطنة التجارية لتحويل هذه الابتكارات إلى منتجات اقتصادية". وقد يُسفر ذلك عن إنشاء مؤسسات جديدة، أو قد يكون جزءًا من إعادة تنشيط مؤسسات قائمة استجابةً لفرصة مُتاحة. [ 511 ] بل إن رواد الأعمال الأمريكيين يُشاركون في تقديم الخدمات العامة من خلال شراكات بين القطاعين العام والخاص .
يشير الشكل الأكثر وضوحًا لريادة الأعمال إلى عملية تأسيس شركات جديدة (تُعرف بالشركات الناشئة ) والمشاركة فيها؛ إلا أنه في السنوات الأخيرة، اتسع نطاق المصطلح ليشمل الأشكال الاجتماعية والسياسية للنشاط الريادي. وعندما تصف ريادة الأعمال الأنشطة داخل شركة أو مؤسسة كبيرة، يُشار إليها بريادة الأعمال الداخلية، وقد تشمل المشاريع المؤسسية، حيث تقوم كيانات كبيرة بفصل مؤسسات تابعة لها. [ 511 ]
According to Paul Reynolds, entrepreneurship scholar and creator of the Global Entrepreneurship Monitor, "by the time they reach their retirement years, half of all working men in the United States probably have a period of self-employment of one or more years; one in four may have engaged in self-employment for six or more years. Participating in a new business creation is a common activity among U.S. workers over the course of their careers."[512] And in recent years, business creation has been documented by scholars such as David Audretsch to be a major driver of economic growth in both the United States and Western Europe.
Venture capital investment

Venture capital, as an industry, originated in the United States, which it still dominates.[513] According to the National Venture Capital Association 11% of private sector jobs come from venture capital backed companies and venture capital backed revenue accounts for 21% of U.S. GDP.[514]
Total U.S. investment in venture capital amounted to $48.3 billion in 2014, for 4,356 deals. This represented "an increase of 61% in dollars and a 4% increase in deals over the prior year", reported the National Venture Capital Association. The Organisation for Economic Cooperation and Development estimates that venture capital investment in the United States had fully recovered by 2014 to pre-recession levels. The National Venture Capital Association has reported that, in 2014, venture capital investment in the life sciences was at its highest level since 2008: in biotechnology, $6.0 billion was invested in 470 deals and, in life sciences overall, $8.6 billion in 789 deals (including biotechnology and medical devices).
Two thirds (68%) of the investment in biotechnology went to first-time/early-stage development deals and the remainder to the expansion stage of development (14%), seed-stage companies (11%) and late-stage companies (7%). However, it was the software industry which invested in the greatest number of deals overall: 1,799, for an investment of $19.8 billion. Second came internet-specific companies, garnering US$11.9 billion in investment through 1,005 deals. Many of these companies are based in the state of California, which alone concentrates 28% of U.S. research.[515]
تلجأ بعض الشركات الأمريكية الناشئة إلى جمع الاستثمارات من المستثمرين الملائكيين (أصحاب رؤوس الأموال المغامرة). في عام 2010، استحوذ قطاع الرعاية الصحية/الطبية على الحصة الأكبر من استثمارات المستثمرين الملائكيين، بنسبة 30% من إجمالي هذه الاستثمارات (مقارنةً بنسبة 17% في عام 2009)، يليه قطاع البرمجيات (16% مقابل 19% في عام 2007)، ثم قطاع التكنولوجيا الحيوية (15% مقابل 8% في عام 2009)، ثم قطاع الصناعة/الطاقة (8% مقابل 17% في عام 2009)، ثم قطاع التجزئة (5% مقابل 8% في عام 2009)، وأخيراً قطاع خدمات تكنولوجيا المعلومات (5%). [ 516 ]
الأمريكيون "مستهلكون مغامرون" يتمتعون باستعداد غير عادي لتجربة منتجات جديدة من جميع الأنواع، ويضغطون على المصنعين لتحسين منتجاتهم. [ 517 ]
عمليات الاندماج والاستحواذ
منذ عام 1985، شهدت البلاد ثلاث موجات رئيسية من عمليات الاندماج والاستحواذ . وكان عام 2017 الأكثر نشاطاً من حيث عدد الصفقات (12,914 صفقة)، بينما بلغ إجمالي قيمة الصفقات في عام 2015 أعلى قيمة إجمالية (24 مليار دولار). [ 518 ]
كانت أكبر صفقة اندماج في تاريخ الولايات المتحدة هي استحواذ شركة أمريكا أونلاين على شركة تايم وارنر عام 2000، حيث تجاوزت قيمة العرض 164 مليار دولار. ومنذ ذلك الحين، ارتفعت عمليات استحواذ المستثمرين الصينيين على الشركات الأمريكية بنسبة 368%. [ 518 ] في المقابل، شهدت عمليات استحواذ الشركات الأمريكية على الشركات الصينية انخفاضًا بنسبة 25%، مع اتجاه تصاعدي قصير حتى عام 2007. [ 518 ]
البحث والتطوير

تستثمر الولايات المتحدة أموالاً في البحث والتطوير أكثر من مجموع استثمارات دول مجموعة السبع الأخرى: بنسبة 17.2% في عام 2012. ومنذ عام 2000، ارتفع إجمالي الإنفاق المحلي على البحث والتطوير في الولايات المتحدة بنسبة 31.2%، مما مكّنها من الحفاظ على حصتها من إجمالي الإنفاق المحلي على البحث والتطوير بين دول مجموعة السبع عند 54.0% (54.2% في عام 2000). [ 515 ]
[[ملف: البحث والتطوير حسب البلد.webp|صورة مصغرة|وسط|
تأثير الركود الاقتصادي على الإنفاق على البحث العلمي
بشكل عام، ارتفع الاستثمار الأمريكي في البحث والتطوير بالتوازي مع نمو الاقتصاد في السنوات الأولى من القرن، قبل أن يتراجع قليلاً خلال فترة الركود الاقتصادي، ثم يعاود الارتفاع مع استئناف النمو. وبلغت قيمة هذا الاستثمار ذروتها في عام 2009، حيث وصلت إلى 406 مليارات دولار أمريكي (2.82% من الناتج المحلي الإجمالي). وعلى الرغم من الركود، فقد استقر عند 2.79% في عام 2012، ومن المتوقع أن ينخفض بشكل طفيف إلى 2.73% في عام 2013، وفقًا للبيانات الأولية، وأن يبقى عند مستوى مماثل في عام 2014. [ 515 ]
The federal government is the primary funder of basic research, at 52.6% in 2012; state governments, universities and other non-profits funded 26%. Experimental development, on the other hand, is primarily funded by industry: 76.4% to the federal government's 22.1% in 2012.[515] While U.S. investment in R&D is high, it failed to reach President Obama's target of 3% of GDP by the end of his presidency in 2016. Between 2009 and 2012, the United States' world share of research expenditure receded slightly from 30.5% to 28.1%. Several countries now devote more than 4% of GDP to R&D (Israel, Japan and the Republic of Korea) and others plan to raise their own GERD/GDP ratio to 4% by 2020 (Finland and Sweden).[515]
Business spending on research
Business enterprises contributed 59.1 % of U.S. GERD in 2012, down from 69.0 % in 2000. Private non-profits and foreign entities each contribute a small fraction of total R&D, 3.3% and 3.8%, respectively.[515]

The United States has historically been a leader in business R&D and innovation. The economic recession of 2008–2009 has had a lasting impact, however. While the major performers of R&D largely maintained their commitments, the pain of the U.S. recession was felt mainly by small businesses and start-ups. Statistics released by the U.S. Census Bureau showed that, in 2008, the number of business 'deaths' began overtaking the number of business 'births' and that the trend continued at least through 2012. From 2003 to 2008, business research spending had followed a generally upward trajectory. In 2009, the curve inverted, as expenditure fell by 4% over the previous year then again in 2010, albeit by 1–2% this time. Companies in high-opportunity industries like health care cut back less than those in more mature industries, such as fossil fuels. The largest cutbacks in R&D spending were in agriculture production: −3.5% compared to the average R&D to net sales ratio. The chemicals and allied products industry and electronic equipment industry, on the other hand, showed R&D to net sales ratios that were 3.8% and 4.8% higher than average. Although the amount of R&D spending increased in 2011, it was still below the level of 2008 expenditure. By 2012, the growth rate of business-funded R&D had recovered. Whether this continues will be contingent on the pursuit of economic recovery and growth, levels of federal research funding and the general business climate.[515]
Research spending at the state level
The level of research spending varies considerably from one state to another. Six states (New Mexico, Maryland, Massachusetts, Washington, California and Michigan) each devoted 3.9% or more of their GDP to R&D in 2010, together contributing 42% of national research expenditure. In 2010, more than one quarter of R&D was concentrated in California (28.1%), ahead of Massachusetts (5.7%), New Jersey (5.6%), Washington State (5.5%), Michigan (5.4%), Texas (5.2%), Illinois (4.8%), New York (3.6%) and Pennsylvania (3.5%). Seven states (Arkansas, Nevada, Oklahoma, Louisiana, South Dakota and Wyoming) devoted less than 0.8% of GDP to R&D.[515]


California is home to Silicon Valley, the name given to the area hosting the leading corporations and start-ups in information technology. This state also hosts biotechnology clusters in the San Francisco Bay Area, Los Angeles and San Diego. The main biotechnology clusters outside California are the cities of Boston/Cambridge, Massachusetts, Maryland, suburban Washington, DC, New York, Seattle, Philadelphia, and Chicago. California supplies 13.7% of all jobs in science and engineering across the country, more than any other state. Some 5.7% of Californians are employed in these fields. Route 128 around Boston in the state of Massachusetts is not only home to numerous high-tech firms and corporations but also hosts Harvard University and Massachusetts Institute of Technology.[515]
New Mexico's high research intensity can be explained by the fact that it hosts the Los Alamos National Laboratory. Maryland's position may reflect the concentration of federally funded research institutions there. Washington State has a high concentration of high-tech firms like Microsoft, Amazon and Boeing and the engineering functions of most automobile manufacturers are located in the state of Michigan.[515]
Research spending by multinational corporations
The federal government and most of the 50 states that make up the United States offer tax credits to particular industries and companies to encourage them to engage in research and development (R&D). Congress usually renews a tax credit every few years. According to a survey by The Wall Street Journal in 2012, companies do not factor in these credits when making decisions about investing in R&D, since they cannot rely on these credits being renewed.[515]
In 2014, four U.S. multinational corporations figured in the Top 50 for the volume of expenditure on R&D: Microsoft, Intel, Johnson & Johnson and Google. Several have figured in the Top 20 for at least ten years: Intel, Microsoft, Johnson & Johnson, Pfizer and IBM. Google was included in this table for the first time in 2013.[515]
Global top 50 companies by R&D volume and intensity, 2014* R&D intensity is defined as R&D expenditure divided by net sales. ** Although incorporated in the Netherlands, Airbus's principal manufacturing facilities are located in France, Germany, Spain and the UK. Source: UNESCO Science Report: towards 2030 (2015), Table 9.3, based on Hernández et al. (2014) EU R&D Scoreboard: the 2014 EU Industrial R&D Investment Scoreboard. European Commission: Brussels, Table 2.2.
Exports of high-tech goods and patents

Until 2010, the United States was a net exporter of pharmaceuticals but, since 2011, it has become a net importer of these goods.
The United States is a post-industrial country. Imports of high-tech products far exceed exports. However, the United States' technologically skilled workforce produces a large volume of patents and can still profit from the license or sale of these patents. Within the United States' scientific industries active in research, 9.1% of products and services are concerned with the licensing of intellectual property rights.[515]
When it comes to trade in intellectual property, the United States remains unrivalled. Income from royalties and licensing amounted to $129.2 billion in 2013, the highest in the world. Japan comes a distant second, with receipts of $31.6 billion in 2013. The United States' payments for use of intellectual property amounted to $39.0 billion in 2013, exceeded only by Ireland ($46.4 billion).[515]
Notable companies and markets

America's largest companies are ranked every year by revenue in the Fortune 500. Between 2000 and 2022's edition of the list, the top spot on the Fortune 500 was occupied by either the auto manufacturer General Motors (GM), the oil and gas giant ExxonMobil, or the retailer Walmart.[520] The US is also home of many of the world's largest companies by market capitalization; As of February 9,2023, the largest American companies by market cap are Apple, Microsoft, Google (through holding company Alphabet), Amazon, Berkshire Hathaway, Tesla, Nvidia, Visa, ExxonMobil, and Meta Platforms.[521] Moreover, many of these companies are the most valuable brands, with many of the largest companies by revenue and market cap on the annual ranking of most valuable brands by Forbes being joined by Coca-Cola, The Walt Disney Company, and McDonald's.[522]
Some industries within America are defined by a few major companies, often deriving terms such as "Big Three" or "Big Four". Examples of this phenomenon include the Big Three credit reporting agencies (Equifax, Experian, and TransUnion), the Big Three automobile makers (Ford, General Motors, and Stellantis), the Big Four accounting firms (Deloitte, Ernst & Young, KPMG, and PwC), and the Big Four communications carriers (Verizon, AT&T, T-Mobile/Sprint, and Dish Network).[523][524] The American energy industry is among the largest and consists of large companies in oil, natural gas, coal, and renewable energy sources. America's largest energy companies by market are in oil and gas, with ExxonMobil being joined by Chevron, ConocoPhillips, and Schlumberger; British oil companies BP and Shell also have significant presence in the United States and trade on both the London Stock Exchange and New York Stock Exchange. Many large American petroleum companies, as well as BP, can trace some origin back to Standard Oil, a former monopoly run by John D. Rockefeller. In coal, the $30 billion industry is dominated by Peabody Energy, which is the largest coal company in the world with almost $23 billion in revenue for 2021. Much of the nation's coal mining occurs in Wyoming and Appalachian states like West Virginia, Pennsylvania, and Kentucky.[525][526][527]
A 2012 Deloitte report published in STORES magazine indicated that of the world's top 250 largest retailers by retail sales revenue in fiscal year 2010, 32% of those retailers were based in the United States, and those 32% accounted for 41% of the total retail sales revenue of the top 250.[528]
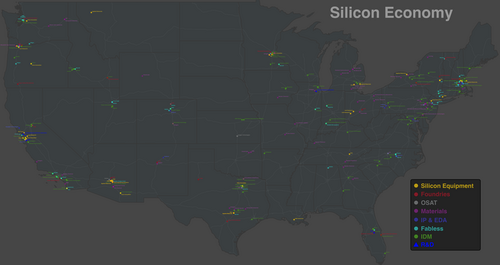
America is the foremost country in the world when it comes to semiconductor production. In 2011, half of the world's 20 largest semiconductor manufacturers by sales were based in America. More recently, Congress under the presidency of Joe Biden passed a bipartisan bill, the CHIPS and Science Act, which bolstered semiconductor production. Some of America's largest semiconductor firms and chip companies are Broadcom, Intel, AMD, and Qualcomm.[529][530][531]
Many of the United States' largest firms by market cap are technology companies. These companies are dominated by the Big Five tech giants (Apple, Amazon, Google, Microsoft, and Meta), though numerous software firms also dominate the American technology industry. These firms range from hardware manufacturers like Dell Technologies, IBM, Hewlett-Packard, and Cisco, to software and computing infrastructure programmers like Oracle, Salesforce, Adobe, and Intuit.[532][533]
In film, American producers create nearly all of the world's highest-grossing films. Many of the world's best-selling music artists are based in the United States. Some of America's largest media companies are The Walt Disney Company, Warner Bros. Discovery, Netflix, Comcast, Paramount Global, and Fox.
Banking and finance

Measured by value of its listed companies' securities, the New York Stock Exchange is more than three times larger than any other stock exchange in the world.[534] As of October 2008, the combined capitalization of all domestic NYSE listed companies was US$10.1 trillion.[535]NASDAQ is another American stock exchange and the world's third-largest exchange after the New York Stock Exchange and Japan's Tokyo Stock Exchange. However, NASDAQ's trade value is larger than Japan's TSE.[534] NASDAQ is the largest electronic screen-basedequity securities trading market in the U.S. With approximately 3,800 companies and corporations, it has more trading volume per hour than any other stock exchange.[536]
Because of the influential role that the U.S. stock market plays in international finance, a New York University study in late 2014 interprets that in the short run, stocks that affect the willingness to bear risk independently of macroeconomic fundamentals explain most of the variation in the U.S. stock market. In the long run, the U.S. stock market is profoundly affected by shocks that reallocate the rewards of a given level of production between workers and shareholders. Productivity shocks, however, play a small role in historical stock market fluctuations at all horizons in the U.S. stock market.[537]
The U.S. finance industry comprised only 10% of total non-farm business profits in 1947, but it grew to 50% by 2010. Over the same period, finance industry income as a proportion of GDP rose from 2.5% to 7.5%, and the finance industry's proportion of all corporate income rose from 10% to 20%. The mean earnings per employee hour in finance relative to all other sectors has closely mirrored the share of total U.S. income earned by the top 1% income earners since 1930. The mean salary in New York City's finance industry rose from $80,000 in 1981 to $360,000 in 2011, while average New York City salaries rose from $40,000 to $70,000. In 1988, there were about 12,500 U.S. banks with less than $300 million in deposits, and about 900 with more deposits, but by 2012, there were only 4,200 banks with less than $300 million in deposits in the U.S., and over 1,800 with more.
Top ten U.S. banks by assets[538][539][540][541]
| 1 | JP Morgan Chase |
| 2 | Bank of America |
| 3 | Citigroup |
| 4 | Wells Fargo |
| 5 | Goldman Sachs |
| 6 | Morgan Stanley |
| 7 | U.S. Bancorp |
| 8 | Bank of NY Mellon |
| 9 | HSBC North American Holdings |
| 10 | Capital One Financial |
A 2012 International Monetary Fund study concluded that the U.S. financial sector has grown so large that it is slowing economic growth. New York University economist Thomas Philippon supported those findings, estimating that the U.S. spends $300 billion too much on financial services per year, and that the sector needs to shrink by 20%. Harvard University and University of Chicago economists agreed, calculating in 2014 that workers in research and development add $5 to the GDP for each dollar they earn, but finance industry workers cause the GDP to shrink by $0.60 for every dollar they are paid.[542] A study by the Bank for International Settlements reached similar conclusions, saying the finance industry impedes economic growth and research and development based industries.[543]
Historical statistics
List of state and territory economies
State and federal district economies
- Economy of Alabama
- Economy of Alaska
- Economy of Arizona
- Economy of Arkansas
- Economy of California
- Economy of Colorado
- Economy of Connecticut
- Economy of Delaware
- Economy of Florida
- Economy of Georgia
- Economy of Hawaii
- Economy of Idaho
- Economy of Illinois
- Economy of Indiana
- Economy of Iowa
- Economy of Kansas
- Economy of Kentucky
- Economy of Louisiana
- Economy of Maine
- Economy of Maryland
- Economy of Massachusetts
- Economy of Michigan
- Economy of Minnesota
- Economy of Mississippi
- Economy of Missouri
- Economy of Montana
- Economy of Nebraska
- Economy of Nevada
- Economy of New Hampshire
- Economy of New Jersey
- Economy of New Mexico
- Economy of New York (state)
- Economy of North Carolina
- Economy of North Dakota
- Economy of Ohio
- Economy of Oklahoma
- Economy of Oregon
- Economy of Pennsylvania
- Economy of Rhode Island
- Economy of South Carolina
- Economy of South Dakota
- Economy of Tennessee
- Economy of Texas
- Economy of Utah
- Economy of Vermont
- Economy of Virginia
- Economy of Washington, D.C.
- Economy of Washington (state)
- Economy of West Virginia
- Economy of Wisconsin
- Economy of Wyoming
Territory economies
See also
References
- ↑Laura Bratton (September 28, 2023). "Sorry, London — New York Is Still the Financial Capital of the World". The Messenger. Archived from the original on October 11, 2023. Retrieved March 26, 2025.
The GDP of the New York City metropolitan area is larger than the country of South Korea...New York City was ranked as the most competitive city in the financial industry for the fifth straight year.
- ↑Iman Ghosh (September 24, 2020). "This 3D map shows the U.S. cities with the highest economic output". World Economic Forum. Retrieved March 26, 2025.
The New York metro area dwarfs all other cities for economic output by a large margin.
- ↑"World Economic Outlook Database Groups and Aggregates Information". International Monetary Fund. October 2024. Retrieved February 10, 2025.
- ↑"World Bank Country and Lending Groups". World Bank. Retrieved February 10, 2025.
- ↑"U.S. and World Population Clock". United States census. Retrieved July 26, 2026.
- 12345678"IMF DataMapper: United States". International Monetary Fund. 2025. Retrieved December 15, 2025.
- ↑"GDP per capita growth (annual %), World Bank Group, accessed July 2025".
- ↑"Contributions to U.S. Gross Domestic Product (GDP): Selected Industries". U.S. Department of Commerce. December 31, 2024. Retrieved April 15, 2026.
- 123"Gross Domestic Product (Second Estimate), Corporate Profits (Preliminary Estimate), First Quarter 2024"(PDF). Bureau of Economic Analysis. May 30, 2024.
- ↑Dickler, Jessica (April 10, 2026). "Here's the inflation breakdown for March 2026 — in one chart". CNBC. Retrieved April 10, 2026.
- 12"Poverty in the United States: 2024". United States Census Bureau. September 10, 2024. Retrieved October 22, 2024.
- ↑"Income Distribution Measures and Percent Change Using Money Income and Equivalence-Adjusted Income"(PDF). census.gov. United States Census Bureau. September 10, 2024.
- ↑"Gini index (World Bank estimate) – United States". data.worldbank.org. World Bank.
- ↑"The Distribution of Household Income, 2020". cbo.gov. Congressional Budget Office. September 11, 2024.
- 12"Human Development Report 2025"(PDF). United Nations Development Programme. May 6, 2025. Archived(PDF) from the original on May 6, 2025. Retrieved May 6, 2025.
- ↑"CPI 2023". Transparency International. January 30, 2024. Archived from the original on February 4, 2023. Retrieved January 30, 2024.
- 12345"Employment status of the civilian population by sex and age". BLS.gov. Bureau of Labor Statistics. Retrieved July 2, 2026.
- ↑"Employment by major industry sector". Bureau of Labor Statistics. Retrieved July 5, 2018.
- 12"Taxing Wages 2026". www.oecd.org. April 22, 2026.
- ↑"Median usual weekly earnings of full-time wage and salary workers by sex, quarterly averages, seasonally adjusted". Bureau of Labor Statistics. Retrieved July 3, 2026.
- ↑"Real average hourly earnings increased 0.8 percent from November 2024 to November 2025 : The Economics Daily : U.S. Bureau of Labor Statistics". Bureau of Labor Statistics. Retrieved June 21, 2026.
- ↑"Interest Rates: Long-Term Government Bond Yields: 10-Year: Main (Including Benchmark) for United States".
- 12"PMI, Purchasing Managers' Index – Manufacturing, Services". www.pmi.spglobal.com.
- 12U.S. Department of Commerce. "Gross Domestic Product, 4th Quarter and Year 2024 (Advance Estimate)". Retrieved January 31, 2025.
- 12Bureau of Economic Analysis. "U.S. International Trade in Goods and Services, December and Annual 2024". Retrieved February 10, 2025.
- ↑"Exports of goods by principal end-use category"(PDF). Census Bureau.
- 1234"U.S. International Trade in Goods and Services December and Annual 2024"(PDF). United States Census Bureau. Retrieved February 7, 2025.
- ↑"Imports of goods by principal end-use category"(PDF). Census Bureau.
- 12"UNCTAD 2022"(PDF). UNCTAD. Retrieved January 6, 2022.
- ↑"Treasury TIC Data". U.S. Department of the Treasury. Retrieved January 30, 2022.
- 123"Report for Selected Countries and Subjects: October 2024". imf.org. International Monetary Fund.
- ↑"U.S. International Reserve Position". Treasury.gov. Retrieved October 22, 2024.
- ↑"Budget and Economic Data". cbo.gov. Congressional Budget Office.
- ↑"Development aid rises again in 2016 but flows to poorest countries dip". OECD. April 11, 2017. Retrieved September 25, 2017.
- ↑"S&P Global Media Center". Standard & Poor's. Retrieved June 1, 2025.
- ↑Moody's Investors Service. "Moody's Ratings downgrades United States ratings to Aa1 from Aaa; changes outlook to stable".
- ↑"Fitch Downgrades the United States' Long-Term Ratings to 'AA+' from 'AAA'; Outlook Stable". Fitch Ratings.
- ↑"U.S. Economy - Basic Conditions & Resources". U.S. Diplomatic Mission to Germany. "The United States is said to have a mixed economy because privately owned businesses and government both play important roles." Retrieved October 24, 2011.
- ↑(4)Outline of the U.S. Economy – (2)How the U.S. Economy Works. U.S. Embassy Information Resource Center. "As a result, the American economy is perhaps better described as a 'mixed' economy, with the government playing an important role along with private enterprise. Although Americans often disagree about exactly where to draw the line between their beliefs in both free enterprise and government management, the mixed economy they have developed has been remarkably successful." Retrieved October 24, 2011.
- ↑"World Bank". International Monetary Fund. July 5, 2025.
- ↑"GDP, PPP (current international $)". Statiata.
- ↑"Report for Selected Country Groups and Subjects (PPP valuation of country GDP)". IMF. Retrieved April 20, 2022.
- 12"The Implementation of Monetary Policy – The Federal Reserve in the International Sphere"(PDF). Retrieved August 24, 2010.
- ↑Wright, Gavin, and Jesse Czelusta, "Resource-Based Growth Past and Present", in Natural Resources: Neither Curse Nor Destiny, ed. Daniel Lederman and William Maloney (World Bank, 2007), p. 185. ISBN 0821365452.
- ↑Vargo, Frank (March 11, 2011). "U.S. Manufacturing Remains World's Largest". Shopfloor. Archived from the original on April 4, 2012. Retrieved March 28, 2012.
- 12"Top Trading Partners". U.S. Census Bureau. December 2016. Retrieved July 8, 2017.
- ↑"World Trade Statistical Review 2019"(PDF). World Trade Organization. p. 100. Retrieved May 31, 2019.
- ↑"United States free trade agreements". Office of the United States Trade Representative. Retrieved May 31, 2019.
- ↑"United States remains the world's top producer of petroleum and natural gas hydrocarbons". EIA.
- ↑Global Status Report on Blood Safety and Availability 2016(PDF). Geneva: World Health Organization. 2017. p. 144. ISBN 978-92-4-156543-1. Retrieved March 3, 2025.
- ↑"National Accounts - Analysis of Main Aggregates (AMA)". unstats.un.org.
- ↑"Total Assets, All Commercial Banks". fred.stlouisfed.org. April 10, 2026. Retrieved April 15, 2026.
- ↑"World Official Gold Holdings - International Financial Statistics, March 2024". World Gold Council. March 5, 2024. Retrieved March 8, 2024.
- ↑"Fortune Global 500". Fortune.
- ↑"Income". Better Life Index. OECD. Retrieved September 28, 2019.
In the United States, the average household net adjusted disposable income per capita is USD 45 284 a year, much higher than the OECD average of USD 33 604 and the highest figure in the OECD.
- ↑"Income distribution database". data-explorer.oecd.org. April 15, 2026. Retrieved April 15, 2026.
- ↑"Gini Index coefficient - distribution of family income - The World Factbook". www.cia.gov. Archived from the original on February 4, 2021. Retrieved August 24, 2022.
- ↑Alston, Philip (2018). "Report of the Special Rapporteur on extreme poverty and human rights on his mission to the United States of America". OHCHR. Retrieved January 16, 2023.
- ↑"Forbes Billionaires 2024". Forbes. Retrieved April 2, 2024.
- ↑"The effect of job security regulations on labor market flexibility: Evidence from the Colombian labor market reform"(PDF). National Bureau of Economic Research. January 2004.
- ↑Kugler, Adriana D.. "The Effect of Job Security Regulations on Labor Market Flexibility: Evidence from the Colombian Labor Market Reform." In Law and Employment: Lessons from Latin America and the Caribbean. Edited by James J. Heckman, and Carmen Pages (eds). University of Chicago Press, 2004. Chicago Scholarship Online, 2013. doi:10.7208/chicago/9780226322858.003.0004.
- ↑"Country comparison :: net migration rate". Central Intelligence Agency. The World Factbook. 2014. Archived from the original on July 9, 2008. Retrieved June 18, 2014.
- ↑Kenworthy, Lane (1999). "Do Social-Welfare Policies Reduce Poverty? A Cross-National Assessment"(PDF). Social Forces. 77 (3): 1119–1139. doi:10.2307/3005973. ISSN 0037-7732. JSTOR 3005973. Archived(PDF) from the original on August 10, 2013.
- ↑Moller, Stephanie; Huber, Evelyne; Stephens, John D.; Bradley, David; Nielsen, François (2003). "Determinants of Relative Poverty in Advanced Capitalist Democracies". American Sociological Review. 68 (1): 22–51. doi:10.2307/3088901. JSTOR 3088901.
- ↑"Monthly Reports - World Federation of Exchanges". WFE.
- ↑Table A – Market Capitalization of the World's Top Stock Exchanges (As at end of June 2012). Securities and Exchange Commission (China).
- ↑"The Capital Markets Fact Book". SIFMA. July 28, 2024. Retrieved April 15, 2026.
Foreign gross activity in U.S. securities increased to $134.7 trillion, +33.8% Y/Y in 2024.
- ↑"2014 Global R&D Funding Forecast"(PDF). battelle.org. December 16, 2013. Archived from the original(PDF) on February 9, 2014.
- ↑Adapting and evolving –Global venture capital insights and trends 2014Archived August 4, 2020, at the Wayback Machine. EY, 2014.
- ↑"Research and development expenditure (% of GDP) - United States". World Bank Open Data. Retrieved April 15, 2026.
- ↑"Shares of gross domestic product: Personal consumption expenditures". fred.stlouisfed.org. March 13, 2026. Retrieved April 15, 2026.
- 12"Personal consumption expenditures (PCE)/gross domestic product (GDP)"FRED Graph, Federal Reserve Bank of St. Louis
- ↑"Rankings: Global Competitiveness Report 2013–2014"(PDF). World Economic Forum. Retrieved June 1, 2014.
- ↑"Colonial Economy". National Museum of American History. May 24, 2018. Archived from the original on September 13, 2023. Retrieved May 20, 2022.
- ↑"Digital History". www.digitalhistory.uh.edu. Retrieved May 20, 2022.
- ↑"Territory Worth Contesting". National Museum of American History. May 24, 2018. Archived from the original on July 12, 2023. Retrieved May 20, 2022.
- ↑"19th century: Immigration Galore – Peopling of NYC: The Immigrant Experience". Retrieved May 20, 2022.
- ↑Baten, Jörg (2016). A History of the Global Economy. From 1500 to the Present. Cambridge University Press. p. 88ff. ISBN 978-1107507180.
- ↑W. J. Rorabaugh; Donald T. Critchlow; Paula C. Baker (2004). America's Promise: A Concise History of the United States. Rowman & Littlefield. p. 210. ISBN 978-0742511897.
- ↑Moore, Geoffrey H.; Zarnowitz, Victor (1986). Appendix A The Development and Role of the National Bureau of Economic Research's Business Cycle Chronologies. University of Chicago Press. pp. 735–780. in Gordon 1986, pp. 743–45
- ↑Knoop, Todd A. (July 30, 2004). Recessions and Depressions: Understanding Business Cycles. Praeger Publishers. pp. 166–71. ISBN 978-0275981624.
- ↑Baten, Jörg (2016). A History of the Global Economy. From 1500 to the Present. Cambridge University Press. p. 95. ISBN 978-1107507180.
- ↑Ehrlich, Isaac; Cook, Adam; Yin, Yong (June 2018). "What Accounts for the US Ascendancy to Economic Superpower by the Early Twentieth Century? The Morrill Act–Human Capital Hypothesis". Journal of Human Capital. 12 (2): 233–281. doi:10.1086/697512. ISSN 1932-8575.
- ↑17.1 the Great Depression and Keynesian Economics. University of Minnesota Libraries Publishing edition, 2016. This edition adapted from a work originally produced in 2011 by a publisher who has requested that it not receive attribution. December 2016. Archived from the original on July 26, 2023. Retrieved August 30, 2022.
- ↑Baten, Jörg (2016). A History of the Global Economy. From 1500 to the Present. Cambridge University Press. p. 97f. ISBN 978-1107507180.
- ↑Steven Mintz and Susan Kellogg, Domestic Revolutions: a Social History of American Family Life (1988) ch 9
- ↑Buchanan, James M. (1977). Democracy in Deficit: The Political Legacy of Lord Keynes. New York: Academic Press. pp. 1–55. ISBN 978-0865972278.
- ↑"Current Population Reports: Money Income of Households and Persons in the United States (1987)"(PDF). U.S. Department of Commerce.
- ↑"Current Population Reports: Income of nonfarm families and individuals (1946)"(PDF). U.S. Department of Commerce.
- ↑Schuman, Michael (February 14, 2011). "Is China facing a Japanese future?". Time. Archived from the original on December 7, 2025. Retrieved February 27, 2012.
- 12"FRED – Total Non-Farm Payrolls". January 1939.
- 12"Financial Crisis Inquiry Report-Conclusions-January 2011". Fcic.law.stanford.edu. March 10, 2011. Retrieved April 22, 2013.
- ↑"FRED – Household Debt Changes". October 1945.
- ↑"Real Gross Domestic Product". fred.stlouisfed.org. November 27, 2024.
- ↑"Households and Nonprofit Organizations; Net Worth, Level". fred.stlouisfed.org. September 12, 2024.
- ↑"FRED – Civilian Unemployment Rate". January 1948.
- ↑The New York Times. Casselbaum. "Up, Up, Up Goes the Economy" March 20, 2018.
- 12"Global Crisis News". GCN. October 30, 2009. Archived from the original on November 3, 2009.
- 12"Worries grow of deeper U.S. recession". CNN. Archived from the original on June 11, 2008. Retrieved November 17, 2008.
- ↑"CIA World Factbook – Debt to GDP". Archived from the original on June 13, 2007.
- ↑Pound, Jesse (August 28, 2020). "Fed's Bullard says the recession is over but rates will 'stay low for a long time'". CNBC. Retrieved September 4, 2020.
- ↑President Trump's statements to reporters gathered at Joint Base Andrews on 5 May 2020, before his departure en route to Phoenix, Arizona, President Donald J. Trump departs from Joint Base Andrews en route to Phoenix on YouTube, May 5, 2020, minutes 10:06–10:14.
- ↑Wiseman, Paul (May 5, 2020). "US trade gap rises to $44.4 billion as virus slams commerce". AP News. Retrieved February 10, 2025.
- ↑Mutikani, Lucia (May 5, 2020). "U.S. trade deficit widens, services sector contracts amid coronavirus". Reuters. Retrieved February 5, 2025.
- ↑Shepardson, David; Rucinski, Tracy (May 6, 2020). "Exclusive: U.S. airlines burn through $10 billion a month as traffic plummets". Reuters.
- ↑"The Great Recession Was Bad. The 'Great Lockdown' Is Worse". BloombergQuint. April 14, 2020. Archived from the original on June 25, 2020. Retrieved April 15, 2020.
- ↑"IMF Says 'Great Lockdown' Worst Recession Since Depression, Far Worse Than Last Crisis". nysscpa.org. Archived from the original on June 18, 2020. Retrieved April 15, 2020.
- ↑Ben Winck (April 14, 2020). "IMF economic outlook: 'Great Lockdown' will be worst recession in century". Business Insider. Retrieved April 27, 2020.
- ↑Larry Elliott Economics, ed. (April 14, 2020). "'Great Lockdown' to rival Great Depression with 3% hit to global economy, says IMF | Business". The Guardian. Retrieved April 27, 2020.
- ↑Jones, Huw (March 24, 2022). "New York widens lead over London in top finance centres index". Reuters. Retrieved June 25, 2022.
- ↑Collinson, Stephen (May 7, 2020). "Trump economy faces long-term disaster as jobs data looms". CNN.
- ↑Ross, Jamie (May 8, 2020). "Trump's Live Reaction to Record Unemployment: Don't Blame Me". Yahoo Business.
- ↑Schneider, Howard; Saphir, Ann (May 13, 2020). "In nod to grim U.S. outlook, Fed's Powell calls for more fiscal support". Reuters.
- ↑Fottrell, Quentin (May 31, 2020). "Over 40 million people filed for unemployment since March – $1,200 stimulus checks are a mere Band-Aid for Americans". MarketWatch (for Yahoo! Finance).
- ↑Shepardson, David (June 4, 2020). "U.S. airlines gain final approval to drop services to 75 domestic airports". Reuters.
- ↑"Fed Expects Unemployment Rate to Stay High: Live Updates". The New York Times. June 10, 2020.
- ↑"US economy grew 5.7% in 2021 in rebound from 2020 recession". ABC News. Retrieved January 28, 2022.
- ↑"Inflation Hits 9.1 Percent, Highest Level in 41 Years". July 13, 2022.
- ↑Aratani, Lauren (2023). "US jobs market remains strong despite high interest rates and debt ceiling fight". The Guardian.
- ↑"The US recovery from COVID-19 in international comparison". Brookings. Retrieved May 14, 2026.
- ↑Cox, Jeff (September 11, 2025). "Consumer prices rose at annual rate of 2.9% in August, as weekly jobless claims jump". CNBC. Retrieved October 12, 2025.
- ↑Harring, Alex (January 30, 2026). "Wealth inequality and the 'K-shaped' economy are more striking than ever, data shows". CNBC. Retrieved July 23, 2026.
- ↑Neelakandan, Laya (October 23, 2025). "Here's where the economy is starting to show 'K-shaped' bifurcation". CNBC. Retrieved July 23, 2026.
- ↑Dicandia, Vittoria (July 13, 2026). "Earnings Gaps in the Aftermath of COVID-19". Economic Commentary (2026–15). doi:10.26509/frbc-ec-202615.
- ↑"The US recovery from COVID-19 in international comparison". Brookings. Retrieved July 30, 2026.
- ↑"Report for Selected Countries and Subjects". IMF.
- ↑FRED-Real GDP-Retrieved July 1, 2018.
- ↑"GDP Update - U.S. Congress Joint Economic Committee". www.jec.senate.gov. Retrieved May 11, 2026.
- ↑"BEA News Release –GDP Second Quarter 2018 –July 27, 2018".
- 12Analysis, US Department of Commerce, BEA, Bureau of Economic. "Bureau of Economic Analysis". bea.gov. Retrieved May 7, 2018.
{{cite web}}: CS1 maint: multiple names: authors list (link) - ↑CIA World Factbook-United States-Retrieved July 29, 2018.
- ↑"FRED –Real GDP per Capita –Annual Average". January 1947.
- ↑The New York Times. Adam Davidson. "Are We Doomed to Slow Growth?" February 17, 2016.
- ↑"CIA World Factbook. "USA Economy"". Archived from the original on June 13, 2007.
- ↑"GDP growth (annual %)". Data.worldbank.org. Retrieved December 8, 2014.
- ↑"National Income and Product Accounts Gross Domestic Product: Second Quarter 2014 (Advance Estimate) Annual Revision: 1999 through First Quarter 2014". Bureau of Economic Analysis. Retrieved July 31, 2014.
- ↑"UNCTADstat – Table view". unctadstat.unctad.org. Archived from the original on October 20, 2017. Retrieved November 26, 2017.
- ↑"Report for Selected Countries and Subjects". imf.org. Retrieved November 26, 2017.
- ↑"The World Factbook – Central Intelligence Agency". cia.gov. Archived from the original on January 7, 2021. Retrieved November 26, 2017.
- ↑Federal Reserve Economic Data-All Employees Total Non-Farm-Retrieved July 29, 2018.
- ↑"CIA World Factbook. "United States". February 16, 2022. Archived from the original on January 7, 2021.
- 123McFeatters, Dale (September 6, 2010). "Saluting 154 million in workforce on Labor Day". Napa Valley Register.
- 123456"Office of Advocacy – Frequently Asked Questions – How important are small businesses to the U.S. economy?"(PDF). SBA.gov. Archived from the original(PDF) on December 2, 2010. Retrieved April 21, 2012.
- ↑"Is a white-collar recession looming?". The Economist. December 4, 2022.
Managerial and professional occupations now make up 44% of total employment, up from 34% in 2000, according to the BLS (see chart).
- ↑"Obama: Small Business 'Heart' of Economy – YouTube". Youtube. March 16, 2009. Archived from the original on December 11, 2021. Retrieved April 21, 2012.
- ↑"Global 500 2010: Global 500 1–100". CNN.
- ↑Walmart Corporate and Financial Facts.
- ↑Hopkin, Jonathan (2020). "American Nightmare: How Neoliberalism Broke US Democracy". Anti-System Politics: The Crisis of Market Liberalism in Rich Democracies. Oxford University Press. pp. 87–92. doi:10.1093/oso/9780190699765.003.0004. ISBN 978-0190699765.
- ↑"Minority population growing in the United States, census estimates show". Los Angeles Times. June 10, 2010.
- ↑"Current Unemployment Rates for States and Historical Highs/Lows". BLS. June 2012. Retrieved June 15, 2012.
- 12"OECD Better Life Index". OECD. Retrieved November 25, 2012.
- ↑Median Household Income for States: 2007 and 2008, September 2009, census.gov.
- ↑Doree Armstrong (February 12, 2014). Jake Rosenfeld explores the sharp decline of union membership, influence. UW Today. See also: Jake Rosenfeld (2014) What Unions No Longer Do.Harvard University Press. ISBN 0674725115
- ↑Keith Naughton, Lynn Doan and Jeffrey Green (February 20, 2015). As the Rich Get Richer, Unions Are Poised for Comeback. Bloomberg.
- "A 2011 study drew a link between the decline in union membership since 1973 and expanding wage disparity. Those trends have since continued, said Bruce Western, a professor of sociology at Harvard University who co-authored the study."
- ↑Michael Hiltzik (March 25, 2015). IMF agrees: Decline of union power has increased income inequality. Los Angeles Times.
- ↑"Doing Business in the United States (2006)". World Bank. Retrieved June 28, 2007.
- ↑Rebecca Ray, Milla Sanes, and John Schmitt (May 2013). No-Vacation Nation Revisited. Center for Economic and Policy Research.
- ↑Tara Siegel Bernard (February 22, 2013). In Paid Family Leave, U.S. Trails Most of the Globe. The New York Times
- ↑Maxwell Strachan, Alissa Scheller, Jan Diehm (October 29, 2013). 15 Ways The United States Is The Best (At Being The Worst). The Huffington Post.
- ↑Ishaan Tharoor (May 20, 2014). MAP: The worst places in the world to be a worker. The Washington Post. see also: ITUC Global Rights Index.
- ↑O'Brien, Fergal; Schneeweiss, Zoe (June 18, 2020). "U.S. Ranked Worst for Workers' Rights Among Major Economies". Bloomberg. Retrieved June 19, 2020.
- ↑Ghilarducci, Teresa (June 14, 2023). "New Study: U.S. Tops Rich Nations As Worst Place To Work". Forbes. Retrieved July 27, 2023.
- ↑Henderson, Kaitlyn (May 3, 2023). "Where hard work doesn't pay off: An index of US labor policies compared to peer nations". Oxfam. Retrieved July 27, 2023.
The US is falling drastically behind similar countries in mandating adequate wages, protections, and rights for millions of workers and their families. The wealthiest country in the world is near the bottom of every dimension of this index.
- ↑Pfeffer, Jeffrey (2018). Dying for a Paycheck: How Modern Management Harms Employee Health and Company Performance – and What We Can Do About It. HarperBusiness. p. 38. ISBN 978-0062800923.
- ↑McGregor, Jena (March 22, 2018). "This professor says the workplace is the fifth leading cause of death in the U.S."The Washington Post. Retrieved July 5, 2019.
- ↑Kinderman, Daniel (2019). "The Neoliberal Revolution in Industrial Relations". Catalyst. 2 (4): 117–118. ISSN 2475-7365.
Neoliberal industrial relations reform and increased employer discretion has enabled employers to significantly increase the performance pressure, with serious repercussions for employees. In the United States, work-related issues including layoffs, job insecurity, toxic cultures, and long hours may be responsible for up to 120,000 deaths a year.
- ↑"Federal Reserve Database-FRED-Data Series UNRATE". Research.stlouisfed.org. September 6, 2013. Retrieved October 20, 2013.
- ↑"Federal Reserve Database-FRED-Data Series Unemploy". Research.stlouisfed.org. January 1948. Retrieved October 20, 2013.
- ↑"Federal Reserve Database-FRED-Data Series U6RATE-March 2013". Research.stlouisfed.org. September 6, 2013. Retrieved October 20, 2013.
- ↑"Federal Reserve Database-CLF160V Data Series". Research.stlouisfed.org. January 1948. Retrieved October 20, 2013.
- ↑"FRED Database – POP Data Series – U.S. Population. November 2012". Research.stlouisfed.org. January 1952. Retrieved October 20, 2013.
- ↑"Millions of Unemployed Face Years Without Jobs" article by Peter S. Goodman in The New York Times February 20, 2010.
- ↑"Immigrants top native born in U.S. job hunt". CNNMoney.com. October 29, 2010.
- ↑"Broader U-6 Unemployment Rate Increases to 17.1% in April". The Wall Street Journal. May 7, 2010.
- ↑"Four million more people working part time than 2 years ago". EconPost.com. March 17, 2010. Archived from the original on July 11, 2010. Retrieved March 30, 2010.
- ↑Schwartz, Nelson (March 3, 2013). "Recovery in U.S. Is Lifting Profits, but Not Adding Jobs". The New York Times. Retrieved March 18, 2013.
- ↑"FRED – All Employees Total Non-farm Payrolls". January 1939.
- ↑Constance Sorrentino; Joyanna Moy (June 2002). "U.S. labor market performance in international perspective"(PDF). Monthly Labor Review. Retrieved August 22, 2013.
- ↑"Chronic Unemployment in the Euro Area: Causes and Cures"(PDF). World Economic Outlook. International Monetary Fund. 1999. Retrieved August 22, 2013.
- ↑"Unemployment". Euro Economics. University of North Carolina. Retrieved August 22, 2013.
Chart
- ↑Time-Life Books, Library of Nations: United States, Sixth European English language printing, 1989
- ↑"Current Population Survey". Bureau of Labor Statistics, U.S. Government. June 5, 2009. Retrieved June 19, 2009.
- ↑"Employment and Unemployment Among Youth Summary". United States Department of Labor. August 27, 2009.
- ↑"The Unemployment News Is Worse For Many". Forbes. June 7, 2013.
- ↑"Gross Domestic Product, 2nd Quarter 2020 (Advance Estimate) and Annual Update | U.S. Bureau of Economic Analysis (BEA)". www.bea.gov. Retrieved June 8, 2021.
- ↑"The U.S. economy added 4.8 million jobs in June, but fierce new headwinds have emerged". The Washington Post. ISSN 0190-8286. Retrieved June 8, 2021.
- ↑Cox, Jeff (July 30, 2020). "Second-quarter GDP plunged by worst-ever 32.9% amid virus-induced shutdown". CNBC. Retrieved June 8, 2021.
- ↑"The US labor market recovered rapidly in 2021 but still fell short even before Omicron wave". PIIE. January 7, 2022. Retrieved April 12, 2022.
- ↑Aratani, Lauren (June 2, 2023). "US jobs market remains strong despite high interest rates and debt ceiling fight". The Guardian.
- ↑McGeever, Jamie (October 29, 2025). "US job market is now 'no hire, more fire'". Reuters.
- ↑Zahn, Max (December 17, 2025). "US economy flashes warning signs in new data, some analysts say". abc News.
- ↑Bartash, Jeffry (December 16, 2025). "U.S. economy sags in December, S&P says, due to tariffs, inflation and softer sales". Market Watch.
- ↑"U.S. business activity growth hits 6-month low in December". Reuters. December 16, 2025.
- 123Edwards, William. "The under-the-radar labor market chart scaring economists right now". Business Insider.
- ↑"The World Factbook (United States)". CIA.gov. September 25, 2013. Archived from the original on January 7, 2021. Retrieved October 26, 2013.
- ↑Federal Reserve Bulletin. September 2017, Vol. 103, No. 3. See PDF: Changes in U.S. Family Finances from 2013 to 2016: Evidence from the Survey of Consumer Finances. Table 1 (on the left) is taken from page 4 of the PDF. Table 2 (on the right) is taken from page 13. See: Survey of Consumer Finances and more data.
- ↑"Poverty and Inequality Platform (PIP): Percentiles". World Bank. 2026. Welfare type: Income. Retrieved March 21, 2026.
- ↑"FRED – Real Median Household Income". January 1984.
- ↑David Leonhardt and Kevin Quealy (April 22, 2014). The American Middle Class Is No Longer the World's Richest. The New York Times.
- ↑"Household Income". Society at a Glance 2014: OECD Social Indicators. Society at a Glance. OECD Publishing. March 18, 2014. doi:10.1787/soc_glance-2014-en. ISBN 9789264200722. Retrieved May 29, 2014.
- ↑"Z.1: Financial Accounts of the United States"(PDF). Federal Reserve Board of Governors. March 6, 2014. Archived from the original(PDF) on May 27, 2014. Retrieved May 31, 2014.
- ↑United Press International (UPI), June 22, 2018, "U.N. Report: With 40M in Poverty, U.S. Most Unequal Developed Nation"
- 123"The Distribution of Household Income, 2016". www.cbo.gov. Congressional Budget Office. July 2019. Retrieved October 11, 2019.
- ↑Krueger, Alan (January 12, 2012). "Chairman Alan Krueger Discusses the Rise and Consequences of Inequality at the Center for American Progress". whitehouse.gov– via National Archives.
- ↑Stewart, Alexander J.; McCarty, Nolan; Bryson, Joanna J. (2020). "Polarization under rising inequality and economic decline". Science Advances. 6 (50) eabd4201. arXiv:1807.11477. Bibcode:2020SciA....6.4201S. doi:10.1126/sciadv.abd4201. PMC 7732181. PMID 33310855. S2CID 216144890.
- ↑Porter, Eduardo (November 12, 2013). "Rethinking the Rise of Inequality". NYT.
- ↑"Why the gap between worker pay and productivity might be a myth". July 23, 2015.
- ↑Rose, Stephen J. (December 2018). "Measuring Income Inequality in the US: Methodological Issues"(PDF). Urban Institute. Retrieved May 25, 2019.
- ↑"Distributional National Accounts: Methods and Estimates for the United States"(PDF). NBER. December 1, 2018. Retrieved October 19, 2019.
- ↑Taylor, Telford (September 26, 2019). "Income inequality in America is the highest it's been since census started tracking it, data shows". The Washington Post. Retrieved September 26, 2019.
- ↑Semega, Jessica; Kollar, Melissa (September 13, 2022). "2021 Income Inequality Increased for First Time Since 2011". census.gov. Retrieved May 2, 2023.
- ↑"The Distribution of Household Income and Federal Taxes, 2010". The US Congressional Budget Office (CBO). December 4, 2013. Retrieved January 6, 2014.
- 12"Evolution of wealth indicators, USA, 1913-2019". WID.world. World Inequality Database. 2022. Archived from the original on July 5, 2023. Retrieved September 6, 2023.
- ↑"FRED "Household and Non-Profit net worth –Real and Nominal"".
- ↑"Federal Reserve – Survey of Consumer Finances 2016".
- ↑"Economist Gabriel Zucman "Wealth Inequality in the United States Since 1913"". Gabriel Zucman | Professor of Economics. October 12, 2014.
- ↑Egan, Matt (September 27, 2017). "Record inequality: The top 1% controls 38.6% of America's wealth". CNNMoney. Archived from the original on September 27, 2017. Retrieved October 12, 2017.
- ↑Steverman, Ben (June 16, 2017). "The U.S. Is Where the Rich Are the Richest". Bloomberg. Retrieved October 22, 2017.
- ↑Hurst, Charles E. (2007). Social Inequality: Forms, Causes, and Consequences. Pearson Education, Inc. p. 34. ISBN 978-0205698295.
- ↑Iqbal Khan; Robert Karofsky; Paul Donovan (2024), Global Wealth Report 2024(PDF), p. 21, Wikidata Q133822249
- ↑Bruenig, Matt (March 24, 2014). "You call this a meritocracy? How rich inheritance is poisoning the American economy". Salon. Retrieved August 24, 2014.
- ↑Staff (March 18, 2014). "Inequality – Inherited wealth". The Economist. Retrieved August 24, 2014.
- ↑Pizzigati, Sam (September 24, 2012). "The 'Self-Made' Hallucination of America's Rich". Institute for Policy Studies. Retrieved August 24, 2014.
- ↑"Median Household Net Worth by Quintile"(PDF). United States Census. Archived from the original(PDF) on September 12, 2014.
- ↑"World Wealth Report 2010 – Resource". June 18, 2010. Archived from the original on April 6, 2012. Retrieved August 10, 2017.
- ↑"Barclays Wealth Insights"(PDF). Archived from the original(PDF) on March 26, 2009. Retrieved February 2, 2017.. Volume 5: Evolving Fortunes. Barclays (2008). p. 7
- ↑"Forbes". Forbes. March 14, 2011. Archived from the original on March 14, 2011.
- ↑Ody, Elizabeth (March 10, 2011). "Carlos Slim Tops Forbes List of Billionaires for Second Year". Bloomberg. Retrieved April 21, 2012.
- ↑"FRED "Homeownership rate for the United States"". January 1965.
- ↑Robert E. Rector; Kirk A. Johnson (January 5, 2004). "Understanding Poverty in America". Archived from the original on March 13, 2010.
- ↑Robert Rector (August 27, 2007). "How Poor Are America's Poor? Examining the "Plague" of Poverty in America". Archived from the original on March 12, 2010.
- ↑W. Michael Cox and Richard Alm (1999), The myths of rich and poor: why we're better off than we think. New York: Basic Books
- ↑Millennials aren't buying homes right now. What if they never do?The Guardian. May 27, 2016.
- ↑Min, Sarah (March 28, 2019). "Average Americans can't afford a home in 70 percent of the country". CBS News. Retrieved April 1, 2019.
- ↑Berr, Johnathan (July 31, 2018). "More Americans are forced to "reside" in their vehicles". CBS MoneyWatch. Retrieved August 2, 2018.
- ↑Quinn, Mattie (July 24, 2018). "'It's the New Form of Affordable Housing': More People Are Living in Their Cars". Governing. Retrieved January 19, 2019.
- ↑Martin, Emmie (June 23, 2017). "MONEY Here's how much housing prices have skyrocketed over the last 50 years". CNBC. Archived from the original on March 28, 2023. Retrieved April 6, 2023.
- ↑"Median home price in the U.S. 2022 and forecast until 2023".
- ↑"U.S. Housing Shortage: Everything, Everywhere, All at Once | Fannie Mae".
- ↑"The US housing shortage is 'awful' and will likely get worse with no apparent end in sight". USA Today.
- ↑Picchi, Aimee (January 12, 2024). "Here's why Americans are so unhappy with the economy, in 3 charts". CBS News. Retrieved January 12, 2024.
- ↑Bergsten, C. Fred (2022). The United States vs. China : the quest for global economic leadership. Cambridge. p. 303. ISBN 978-1-5095-4735-7. OCLC 1255691875.
{{cite book}}: CS1 maint: location missing publisher (link) - ↑Lee, Nathaniel (July 19, 2022). "Why American wages haven't grown despite increases in productivity". CNBC. Retrieved November 25, 2022.
- ↑DeSilver, Drew (August 7, 2018). "For most U.S. workers, real wages have barely budged in decades". Pew Research Center. Retrieved November 25, 2022.
- ↑"Wage Stagnation in Nine Charts". Economic Policy Institute. Retrieved November 25, 2022.
- ↑Mattei, Clara E. (2022). The Capital Order: How Economists Invented Austerity and Paved the Way to Fascism. University of Chicago Press. p. 18. ISBN 978-0226818399.
- ↑Derek, Thompson (March 4, 2013). "Corporate Profits Are Eating the Economy". The Atlantic. Retrieved March 18, 2013.
- ↑"Real Disposable Personal Income: Per capita"Federal Reserve Bank of St. Louis, 2013
- ↑"The Rich Are Enjoying The Recovery While Wages Fall For Everyone Else"ThinkProgress, January 25, 2013.
- ↑"US Census Bureau, females, 18 or older, unemployed, personal income, 2005". Archived from the original on February 5, 2012. Retrieved December 8, 2006.
- ↑"US Census Bureau, male, 18 or older, employed full-time year round, 2005". Archived from the original on February 5, 2012. Retrieved December 8, 2006.
- ↑"US Census Bureau, 18+ age, 2005". Archived from the original on February 5, 2012. Retrieved December 8, 2006.
- ↑"US Census Bureau, Personal income for all sexes, races in 2005". Archived from the original on March 19, 2007. Retrieved November 19, 2006.
- ↑Desilver, Drew (October 9, 2014). "For most workers, real wages have barely budged for decades". Pew Research Center. Archived from the original on August 6, 2018. Retrieved July 20, 2018.
But a look at five decades' worth of government wage data suggests that the better question might be, why should now be any different? For most U.S. workers, real wages –that is, after inflation is taken into account –have been flat or even falling for decades, regardless of whether the economy has been adding or subtracting jobs.
- ↑Smith, Noah (July 25, 2018). "How About a Free Market for Wages?". Bloomberg Opinion. Retrieved August 31, 2018.
- ↑Picchi, Aimee (August 24, 2017). "Vast number of Americans live paycheck to paycheck". CBS News. Retrieved August 25, 2017.
- ↑Albrecht, Leslie (September 27, 2017). "One-third of American households can't afford food, shelter or medical care". Marketwatch. Retrieved October 6, 2017.
- ↑Getlen, Larry (July 23, 2018). "America's middle class is slowly being 'wiped out'". MarketWatch. Retrieved July 29, 2018.
- ↑Long, Heather (February 13, 2019). "Record 7 million Americans are 3 months behind on car payments". boston.com. Retrieved February 15, 2019.
- ↑Neel, Joe; Neighmond, Patti (May 21, 2019). "Poll: Many Rural Americans Struggle With Financial Insecurity, Access To Health Care". NPR. Retrieved May 21, 2019.
- ↑Long, Heather (July 4, 2019). "'This doesn't look like the best economy ever': 40% of Americans say they still struggle to pay bills". The Washington Post. Retrieved July 5, 2019.
- ↑Romo, Vanessa (July 14, 2021). "Rents Are Out Of Reach For Most Americans Earning Minimum Wage, A Study Says". NPR. Retrieved July 15, 2021.
- ↑Picchi, Aimee (September 12, 2023). "America's poverty rate soared last year. Children were among the worst hit". CBS News. Retrieved September 15, 2023.
- ↑Picchi, Aimee (July 1, 2026). "This number helps explain why many Americans are down on the economy". CBS News. Retrieved July 9, 2026.
American workers are taking home a smaller share of the nation's income — capturing less of what the economy produces — due to several long-standing issues, ranging from the erosion of union membership to tax law changes that have steered more gains to CEOs, investors and high-income Americans, economists told CBS News.
- ↑Woolf, Steven; Aaron, Laudon (2013). U.S. Health in International Perspective. National Research Council and Institute of Medicine. pp. 171–72. doi:10.17226/13497. ISBN 978-0-309-26414-3. PMID 24006554. Retrieved April 8, 2013.
- ↑"Extreme Poverty in the United States, 1996 to 2011"Archived December 17, 2019, at the Wayback MachineNational Poverty Center, February 2012.
- ↑Walker, Duncan (March 6, 2013). "The children going hungry in America". BBC News. Retrieved March 13, 2013.
- ↑Report finds 44 percent of U.S. children live in low-income families. PBS Newshour. April 6, 2015.
- ↑"U.S. Census Bureau –Income and Poverty in the United States 2016".
- ↑IMF warns the US over high poverty. BBC, June 22, 2016.
- ↑"Trends in Family Wealth, 1989 to 2013". Congressional Budget Office. August 18, 2016.
- 12Kneebone, Elizabeth; Nadeau, Carey; Berube, Alan (November 3, 2011). "The Re-Emergence of Concentrated Poverty: Metropolitan Trends in the 2000s". Brookings Institution.
- ↑Shah, Neil (October 11, 2013).U.S. Poverty Rate Stabilizes –For Some. The Wall Street Journal (New York).
- ↑Singh, Kanishka (December 27, 2024). "US homelessness rose by record 18% in latest annual data". Reuters. Retrieved February 13, 2025.
- ↑Waldmeir, Patti (February 10, 2025). "The growing problem of child homelessness in the US". Financial Times. Retrieved February 13, 2025.
- ↑"HUD 5th Annual Homelessness Assessment Report to Congress, June 2010"(PDF). Retrieved October 20, 2013.
- ↑Employment and HomelessnessArchived May 26, 2019, at the Wayback Machine. National Coalition for the Homeless, July 2009.
- ↑McCormick, Erin (February 7, 2022). "'Homelessness is lethal': US deaths among those without housing are surging". The Guardian. Retrieved June 16, 2023.
- ↑Smeeding, T.M. (2005). "Public Policy: Economic Inequality and Poverty: The United States in Comparative Perspective". Social Science Quarterly. 86: 955–83. doi:10.1111/j.0038-4941.2005.00331.x.
- ↑Kenworthy, L. (1999). "Do Social-Welfare Policies Reduce Poverty? A Cross-National Assessment"(PDF). Social Forces. 77 (3): 1119–39. doi:10.1093/sf/77.3.1119.
- ↑Bradley, D.; E. Huber; S. Moller; F. Nielsen & J.D. Stephens (2003). "Determinants of Relative Poverty in Advanced Capitalist Democracies". American Sociological Review. 68 (1): 22–51. doi:10.2307/3088901. JSTOR 3088901. S2CID 144289954.
- ↑Kevin Drum (September 26, 2013). We Can Reduce Poverty If We Want To. We Just Have To Want To.Mother Jones.
- ↑Gould, Elise and Wething, Hilary (July 24, 2012). "U.S. poverty rates higher, safety net weaker than in peer countries."Economic Policy Institute.
- ↑Temin, Peter (2017). The Vanishing Middle Class: Prejudice and Power in a Dual Economy. MIT Press. ISBN 978-0262036160.
- ↑Alston, Philp (December 15, 2017). "Extreme poverty in America: read the UN special monitor's report". The Guardian. Retrieved December 16, 2017.
- ↑""Contempt for the poor in US drives cruel policies," says UN expert". OHCHR. June 4, 2018. Retrieved June 6, 2018.
- ↑Danelski, David (April 17, 2023). "Poverty is the 4th greatest cause of U.S. deaths". news.ucr.edu. Retrieved June 23, 2023.
- ↑Brady, David; Kohler, Ulrich; Zheng, Hui (2023). "Novel Estimates of Mortality Associated With Poverty in the US". The Journal of the American Medical Association. 183 (6): 504–628. doi:10.1001/jamainternmed.2023.0276. PMC 10111231. PMID 37067817.
- ↑Jarow, Oshan (July 14, 2023). "Poverty is a major public health crisis. Let's treat it like one". Vox. Retrieved September 3, 2023.
Their results find poverty is America's fourth-leading risk factor for death, behind only heart disease, cancer, and smoking. A single year of poverty, defined relatively in the study as having less than 50 percent of the US median household income, is associated with 183,000 American deaths per year. Being in "cumulative poverty," or 10 years or more of uninterrupted poverty, is associated with 295,000 annual deaths.
- ↑Bruce Western. Poverty Politics and Crime Control in Europe and America. Contemporary Sociology Vol. 40, No. 3 (May 2011), pp. 283–86
- ↑Stephen Haymes, Maria Vidal de Haymes and Reuben Miller (eds), The Routledge Handbook of Poverty in the United States, (London: Routledge, 2015), ISBN 0415673445, pp. 3, 346.
- ↑Wacquant, Loïc (2009). "America as Living Laboratory of the Neoliberal Future". Punishing the Poor: The Neoliberal Government of Social Insecurity. Duke University Press. pp. xi–xxiii, 125–26, 312. ISBN 978-0822344223.
- ↑Marie Gottschalk. Caught: The Prison State and the Lockdown of American Politics.Princeton University Press, 2014. ISBN 0691164053p. 10
- ↑Desmond, Matthew (2023). Poverty, by America. Crown Publishing Group. p. 62. ISBN 9780593239919.
- ↑Rank, Mark Robert (2023). The Poverty Paradox: Understanding Economic Hardship Amid American Prosperity. Oxford University Press. pp. 4, 121. ISBN 978-0190212636.
The tendency of our free market economy has been to produce a growing number of jobs that will no longer support a family. In addition, the basic nature of capitalism ensures that unemployment exists at modest levels. Both of these directly result in a shortage of economic opportunities in American society. In addition, the absence of social supports stems from failings at the political and policy levels. The United States has traditionally lacked the political desire to put in place effective policies and programs that would support the economically vulnerable. Structural failing at the economic and political levels have therefore produced a lack of opportunities and supports, resulting in high rates of American poverty. (p.121)
- ↑"Federal Subsidies for Health Insurance Coverage for People Under Age 65". CBO. March 24, 2016.
- ↑OECD Health at a Glance 2015 –Table 3.3. November 7, 2023. doi:10.1787/7a7afb35-en. ISBN 978-92-64-77767-5.
- ↑"Federal Subsidies for Health Insurance Coverage for People Under Age 65: 2018 to 2028". May 23, 2018. Retrieved June 17, 2018.
- ↑"Health Insurance Coverage in the United States: 2016". census.gov.
- ↑"Health Insurance Historical Tables –HIC Series". Census.
- ↑Collins, Sara R.; Gunja, Munira Z.; Doty, Michelle M.; Bhupal, Herman K. (May 1, 2018). "Commonwealth Fund – First Look at Health Insurance Coverage in 2018 Finds ACA Gains Beginning to Reverse". To the Point. Commonwealth Fund. doi:10.26099/aacp-5268.
- ↑Woolhandler, S.; et al. (September 12, 2012). "Despite slight drop in uninsured, last year's figure points to 48,000 preventable deaths". Physicians for a National Health Program. Archived from the original on September 24, 2012. Retrieved September 26, 2012.
- ↑Goodman, John (September 21, 2009). "Does Lack Of Insurance Cause Premature Death?". Health Affairs Forefront. Health Affairs. doi:10.1377/forefront.20090921.002196.
- ↑Kronick, Richard (August 2009). "Health Insurance Coverage and Mortality Revisited". Health Services Research. 44 (4): 1211–31. doi:10.1111/j.1475-6773.2009.00973.x. PMC 2739025. PMID 19453392.
- ↑Cowen, Tyler (October 5, 2006). "Poor U.S. Scores in Health Care Don't Measure Nobels and Innovation". The New York Times. Retrieved October 9, 2012.
- ↑Whitman, Glen; Raad, Raymond. "Bending the Productivity Curve: Why America Leads the World in Medical Innovation". The Cato Institute. Retrieved October 9, 2012.
- ↑National Research Council (US); Woolf, S. H.; Aron, L. (2013). "U.S. Health in International Perspective: Shorter Lives, Poorer Health" (2013) National Institutes of Health Committee on Population, Board on Population Health and Public Health Practice. Books.nap.edu. doi:10.17226/13497. ISBN 978-0-309-26414-3. PMID 24006554. Retrieved October 20, 2013.
- 12CDCTobaccoFree (May 4, 2018). "Economic Trends in Tobacco". Centers for Disease Control and Prevention. Retrieved June 3, 2019.
- ↑Martin, Nicole (August 21, 2007). "UK cancer survival rate lowest in Europe". The Daily Telegraph. Archived from the original on January 11, 2022. Retrieved August 19, 2013.
- ↑Verdecchia, A; Francisci, S; Brenner, H; Gatta, G; Micheli, A; Mangone, L; Kunkler, I; EUROCARE-4 Working, Group (September 2007). "Recent cancer survival in Europe: a 2000–02 period analysis of EUROCARE-4 data". The Lancet Oncology. 8 (9): 784–96. doi:10.1016/s1470-2045(07)70246-2. PMID 17714993.
{{cite journal}}: CS1 maint: numeric names: authors list (link) - ↑MD, Scott W. Atlas (2011). In excellent health : setting the record straight on America's health care and charting a path for future reform. Stanford, California: Hoover Institution Press, Stanford University. pp. 199–205. ISBN 978-0817914448.
- ↑Atlas 2011, pp. 205–07
- ↑Wolf-Maier, K. (November 24, 2003). "Hypertension Treatment and Control in Five European Countries, Canada, and the United States". Hypertension. 43 (1): 10–17. doi:10.1161/01.HYP.0000103630.72812.10. PMID 14638619.
- ↑Atlas 2011, pp. 150–56
- ↑O'Neill, June E.; O'Neill, Dave M. (2008). "Health Status, Health Care and Inequality: Canada vs. the U.S"(PDF). Forum for Health Economics & Policy. 10 (1). doi:10.2202/1558-9544.1094. S2CID 73172486.
- ↑McDonald, Andy (September 28, 2018). "U.S. Drops To 27th In The World For Education And Health Care". The Huffington Post. Retrieved October 6, 2018.
- ↑"OECD Statistical Database –Health expenditure and financing".
- ↑"FastStats". cdc.gov. July 18, 2017.
- ↑Conover, Christopher J. (October 4, 2004). "Health Care Regulation A $169 Billion Hidden Tax"(PDF). Cato Institute. Retrieved September 2, 2014.
- 12"Why Does Health Care Cost so Much in America? Ask Harvard's David Cutler". Public Broadcasting Service. November 19, 2013.
- ↑Lawler, Joseph (September 19, 2012). "Health Care Economist John Goodman on Market-Based Health Care". Real Clear Policy. Retrieved September 2, 2014.
- ↑Pear, Robert (August 16, 2011). "Medicaid Pays Less Than Medicare for Many Prescription Drugs, U.S. Report Finds". The New York Times.
- ↑Dobson, A.; DaVanzo, J.; Sen, N. (January 1, 2006). "The Cost-Shift Payment 'Hydraulic': Foundation, History, And Implications". Health Affairs. 25 (1): 22–33. doi:10.1377/hlthaff.25.1.22. PMID 16403741.
- ↑Pope, Christopher (August 9, 2013). "Legislating Low Prices: Cutting Costs or Care?". The Heritage Foundation. Archived from the original on August 12, 2013. Retrieved September 2, 2014.
- ↑"Latest U.S. Agricultural Trade Data." USDA Economic Research Service. Ed. Stephen MacDonald. USDA, 6 Sept. 2018.
- ↑"2017 Census of Agriculture". farmlandinfo.org. April 11, 2019. Archived from the original on September 4, 2021. Retrieved September 4, 2021.
- ↑Hatfield, J., 2012: Agriculture in the Midwest. In: U.S. National Climate Assessment Midwest Technical Input ReportArchived 2013-06-21 at the Wayback Machine. J. Winkler, J. Andresen, J. Hatfield, D. Bidwell, and D. Brown, coordinators. Available from the Great Lakes Integrated Sciences and Assessments (GLISA) Center
- 12"Monthly Energy Review". EIA. November 26, 2024. 1.3 Primary energy consumption by source. Retrieved December 12, 2024.
- ↑EMBER Energy (April 8, 2025). "United States of America". Ember Energy. Retrieved May 14, 2025.
- ↑"U.S. energy facts explained". EIA. July 15, 2024. Retrieved December 12, 2024.
- ↑"Monthly Energy Review". EIA. April 25, 2023. 2.1a Energy consumption: Residential, commercial, and industrial sectors. Retrieved May 2, 2023.
- ↑"Monthly Energy Review". EIA. April 25, 2023. 2.1b Energy consumption: Transportation sector, total end-use sectors, and electric power sector. Retrieved May 2, 2023.
- ↑"Electric Power Annual". EIA. November 26, 2024. 4.3. Existing capacity by energy source. Retrieved December 12, 2024.
- 12"Monthly Energy Review". EIA. November 26, 2024. 7.2b Electric power sector. Retrieved December 12, 2024.
- ↑"Monthly Energy Review". EIA. November 26, 2024. 2.1b Energy consumption: Transportation sector, total end-use sectors, and electric power sector. Retrieved December 12, 2024.
- ↑"Monthly Energy Review". EIA. November 26, 2024. Appendix A6. Retrieved December 12, 2024.
- 12"International". EIA. Retrieved April 14, 2023.
- ↑
- ↑"Profile for the USA"(PDF). FAO. Archived from the original(PDF) on May 18, 2017.
- ↑FAO: Fisheries and Aquaculture 2005 statistics.
- ↑US Geological Survey, Mineral Commodity Summaries, 2016.
- ↑US EPA, OLEM (May 27, 2015). "Abandoned Mine Lands: Site Information". US EPA. Retrieved May 6, 2020.
- ↑"USGS Gold Production Statistics"(PDF).
- ↑"USGS Copper Production Statistics"(PDF).
- ↑"USGS Platinum Production Statistics"(PDF).
- ↑"USGS Silver Production Statistics"(PDF).
- ↑"USGS Rhenium Production Statistics"(PDF).
- ↑"USGS Sulfur Production Statistics"(PDF).
- ↑"USGS Phosphate Production Statistics"(PDF).
- ↑"USGS Molybdenum Production Statistics"(PDF).
- ↑"USGS Lead Production Statistics"(PDF).
- ↑"USGS Zinc Production Statistics"(PDF).
- ↑"USGS Vanadinum Production Statistics"(PDF).
- ↑"USGS Iron Ore Production Statistics"(PDF).
- ↑"USGS Potash Production Statistics"(PDF).
- ↑"USGS Cobalt Production Statistics"(PDF).
- ↑"USGS Titanium Production Statistics"(PDF).
- ↑"USGS Gypsum Production Statistics"(PDF).
- ↑"USGS Kyanite Production Statistics"(PDF).
- ↑"USGS Lime Production Statistics"(PDF).
- ↑"USGS Salt Production Statistics"(PDF).
- ↑"- World Nuclear Association". world-nuclear.org.
- 12Egan, Matt (December 19, 2023). "The United States is producing more oil than any country in history". CNN.
- ↑American Petroleum Institute, , accessed 20 February 2010.
- ↑"Crude Oil Production". www.eia.gov. Retrieved April 29, 2021.
- ↑Kemp, John (March 3, 2024). "Record US oil and gas production keeps prices under pressure". Reuters.
- ↑"All Employees, Oil and Gas Extraction". Bureau of Labor Statistics. via Federal Reserve Economic Data. April 5, 2024.
- ↑"Oil and the environment - U.S. Energy Information Administration (EIA)". www.eia.gov. Retrieved December 4, 2025.
- ↑"Manufacturing Output by Country". imt. Archived from the original on July 27, 2013. Retrieved April 4, 2014.
- ↑"World Book at NASA". Archived from the original on July 31, 2010. Retrieved March 5, 2022.
- ↑Martin Crutsinger (April 20, 2007). "Factory jobs: 3 million lost since 2000". USA Today. Associated Press. Retrieved March 4, 2012.
- ↑Michael Lind (December 1, 2011). "The Cost of Free Trade". The American Prospect. Retrieved March 3, 2012.
- ↑"What Accounts for the Decline in Manufacturing Employment?". February 18, 2004. Retrieved August 10, 2017.
- ↑"Congressional Record V. 148, Pt. 4, April 11, 2002 to April 24, 2002". United States Government Printing Office.
- ↑UNESCO Science Report: towards 2030. Paris: UNESCO Publishing. 2015. p. 141. ISBN 978-9231001291.
- ↑"Manufacturing Output by Country". Greyhill Advisors. Retrieved October 5, 2011.
- ↑"What Accounts for the Decline in Manufacturing Employment?". Congressional Budget Office. Retrieved October 5, 2011.
- ↑Harold Meyerson (November 29, 2011). "Back from China?". The American Prospect. Retrieved March 4, 2012.
- ↑Carl Pope (January 18–20, 2012). "America's Dirty War Against Manufacturing: Part 1". Bloomberg. Retrieved January 22, 2012.Part 2. Part 3.
- ↑Dean Baker (January 22, 2012). "Hasn't Anyone at the NYT Heard of Exchange Rates?". Beat the Press. Center for Economic and Policy Research. Archived from the original on April 3, 2015. Retrieved January 22, 2012.
- ↑"Interstate FAQ (Question #3)". Federal Highway Administration. 2006. Retrieved March 4, 2009.
- ↑"Public Road and Street Mileage in the United States by Type of Surface". United States Department of Transportation. Archived from the original on January 2, 2015. Retrieved January 13, 2015.
- ↑"China Expressway System to Exceed US Interstates". New Geography. Grand Forks, ND. January 22, 2011. Retrieved September 16, 2011.
- ↑"China overtakes US in car sales". The Guardian. London. January 8, 2010. Retrieved July 10, 2011.
- ↑"Motor vehicles statistics – countries compared worldwide". NationMaster. Retrieved July 10, 2011.
- ↑"Household, Individual, and Vehicle Characteristics". 2001 National Household Travel Survey. U.S. Dept. of Transportation, Bureau of Transportation Statistics. Archived from the original on September 29, 2007. Retrieved August 15, 2007.
- ↑Renne, John L.; Wells, Jan S. (2003). "Emerging European-Style Planning in the United States: Transit-Oriented Development"(PDF). Rutgers University. p. 2. Archived from the original(PDF) on September 24, 2014. Retrieved June 11, 2007.
- ↑Benfield, Kaid (May 18, 2009). "NatGeo surveys countries' transit use: guess who comes in last". Natural Resources Defense Council. Archived from the original on January 20, 2015. Retrieved January 6, 2015.
- ↑"Intercity Passenger Rail: National Policy and Strategies Needed to Maximize Public Benefits from Federal Expenditures". U.S. Government Accountability Office. November 13, 2006. Retrieved June 20, 2007.
- ↑"The Economist Explains: Why Americans Don't Ride Trains". The Economist. August 29, 2013. Retrieved May 12, 2015.
- ↑"Amtrak Ridership Records". Amtrak. June 8, 2011. Retrieved February 29, 2012.
- ↑McGill, Tracy (January 1, 2011). "3 Reasons Light Rail Is an Efficient Transportation Option for U.S. Cities". MetaEfficient. Retrieved June 14, 2013.
- ↑"Privatization". downsizinggovernment.org. Cato Institute. Retrieved December 27, 2014.
- ↑"Scheduled Passengers Carried". International Air Transport Association (IATA). 2011. Archived from the original on November 13, 2013. Retrieved February 17, 2012.
- ↑"Preliminary World Airport Traffic and Rankings 2013 – High Growth Dubai Moves Up to 7th Busiest Airport – March 31, 2014". Airports Council International. March 31, 2014. Archived from the original on April 1, 2014. Retrieved May 17, 2014.
- ↑Barr, Robert (June 8, 2011). "China surpasses US as top energy consumer – Business – Oil & energy – NBC News". NBC News. Archived from the original on February 15, 2020. Retrieved April 21, 2012.
- ↑World Per Capita Total Primary Energy Consumption,1980–2005 (MS Excel format)
- ↑World Resources Institute "Energy Consumption: Consumption per capita" (2001). Nations with higher per-capita consumption are: Qatar, Iceland, United Arab Emirates, Bahrain, Luxembourg and Canada. Except for Canada, these are small countries with a prominent energy-intensive industry such as oil refining or steelmaking.
- ↑US Dept. of Energy, "Annual Energy Report" (July 2006), Energy Flow diagram
- ↑Tertzakian, Peter (November 15, 2005). "The U.S. Senate's Oil Spill". Forbes. Archived from the original on February 14, 2006. Retrieved April 21, 2012.
- ↑"Domestic Demand for Refined Petroleum Products by Sector". U.S. Bureau of Transportation Statistics. Archived from the original on March 30, 2013. Retrieved August 23, 2014.
- ↑"U.S. Imports of Crude Oil". U.S. Census Bureau.
- ↑Pleven, Liam (November 30, 2011). "The Wall Street Journal". Retrieved April 21, 2012.
- ↑Kahn, Chris (December 31, 2011). "In a first, gas and other fuels top U.S. exports". Florida Today. Melbourne, FL. p. 4A. Archived from the original on March 11, 2012.
- ↑"IPTO – Information Processing Techniques Office"Archived July 2, 2014, at the Wayback Machine, The Living Internet, Bill Stewart (ed), January 2000.
- ↑INTERNATIONAL VISITORS SPEND $14.3 BILLION IN FEBRUARY 2013, UP 5 PERCENT FROM FEBRUARY 2012, April 15, 2013, archived from the original on September 15, 2015, retrieved April 19, 2013
- ↑Places, Cory Price July 16 2024 in (July 16, 2024). "America's Most Visited Cities". WorldAtlas. Retrieved December 5, 2025.
{{cite web}}: CS1 maint: numeric names: authors list (link) - ↑"Spain posts record number of 82 million inbound tourists in 2017". 10 January 2018. Retrieved 10 February 2018
- 12"France learns to speak 'touriste'". Associated Press.
- ↑"Global Trade Alert – Independent monitoring of policies that affect world trade". globaltradealert.org.
- ↑World Bank, 2024 data: Exports of goods and services (current US$)Imports of goods and services (current US$)
- ↑World Trade Organisation, Global Trade Outlook and Statistics, March 2026, p.25: "In 2025, the United States remained the largest services trader."
- ↑"Free exchange: Petrodollar profusion". The Economist.
- ↑"North American Free Trade Agreement | History, Purpose, & Provisions". Encyclopedia Britannica. Retrieved March 24, 2020.
- ↑"North American Free Trade Agreement (NAFTA) | United States Trade Representative". ustr.gov. Archived from the original on May 8, 2020. Retrieved March 24, 2020.
- ↑"U.S. International Trade in Goods and Services"(PDF). BEA. February 5, 2015. Archived from the original(PDF) on September 6, 2017. Retrieved March 9, 2018.
- ↑"FRED – Trade Balance, Goods and Services, Balance of Payments Basis". January 1992.
- ↑"U.S. International Trade in Goods and Services –Historical Series".
- ↑"Census – Foreign Trade – Balance by Partner Country".
- ↑"IMF: US accounts for one-third of annual remittances to Developing Countries of $100bn". Finfacts.com. Archived from the original on December 22, 2015. Retrieved April 21, 2012.
- ↑"This chart shows how America stacks up in trade with everyone in the world". Business Insider. Retrieved March 20, 2018.
- ↑FY 2010 Budget Historical Tables. pp. 127–28.
- ↑"US spends its way to 28 Eiffel towers: made out of pure gold". The Times. March 17, 2006.
- ↑"Senate backs increase in debt limit to $14.3 trillion". Reuters. January 28, 2010.
- ↑"2010 Budget-Summary Tables S-13 and S-14"(PDF). Archived from the original(PDF) on October 10, 2011. Retrieved July 21, 2014.
- ↑"Debt has become America's life blood[link removed]". Abc.net.au. December 15, 2009.
- ↑"Wave of Debt Payments Facing US Government". The New York Times. November 22, 2009.
- ↑"FRED – Household and Non-Profit Net Worth". October 1945.
- ↑"Treasury Direct – Monthly Statement of the Public Debt". Archived from the original on February 13, 2020. Retrieved June 19, 2018.
- ↑"CIA World Factbook – USA". February 16, 2022. Archived from the original on January 7, 2021.
- ↑"CBO. Budget & Economic Outlook 2018–2028". April 9, 2018.
- ↑Fox, Michelle (March 1, 2024). "The U.S. national debt is rising by $1 trillion about every 100 days". CNBC.
- ↑"Analytical Perspectives of the FY 2008 BudgetArchived January 7, 2010, at the Wayback Machine".
- ↑"Major Foreign Holders of Treasury Securities". United States Department of the Treasury. July 2014. Archived from the original on October 17, 2015. Retrieved August 23, 2014.
- ↑Federal Reserve (June 5, 2014). "Z.1 Financial Accounts of the United States – Flow of Funds, Balance Sheets, and Integrated Macroeconomic Accounts – First Quarter 2014"(PDF). Archived from the original(PDF) on July 2, 2010. Retrieved July 3, 2010.
- ↑Federal Reserve (June 5, 2014). "Z.1 Financial Accounts of the United States – Flow of Funds, Balance Sheets, and Integrated Macroeconomic Accounts – Historical Annual Tables 2005–2013"(PDF). Archived from the original(PDF) on August 13, 2014.
- ↑Saint Louis Federal Reserve (2012) "5-Year Treasury Inflation-Indexed Security, Constant Maturity" FRED Economic Data chart from government debt auctions (the x-axis at y=0 represents the inflation rate over the life of the security)
- 12Carmen M. Reinhart and M. Belen Sbrancia (March 2011) "The Liquidation of Government Debt" National Bureau of Economic Research working paper No. 16893
- ↑David Wessel (August 8, 2012) "When Interest Rates Turn Upside Down"The Wall Street Journal (full textArchived January 20, 2013, at the Wayback Machine)
- ↑Lawrence Summers (June 3, 2012) "Breaking the negative feedback loop"Reuters
- ↑William H. Gross (May 2, 2011) "The Caine Mutiny (Part 2)"Archived October 13, 2012, at the Wayback MachinePIMCO Investment Outlook
- ↑U.S. Treasury (January 31, 2012) "Minutes of the Meeting of the Treasury Borrowing Advisory Committee of the Securities Industry and Financial Markets Association"
- ↑"US consumer confidence deteriorates in November". Reuters. November 2025. Retrieved November 30, 2025.
- ↑"The Implementation of Monetary Policy – The Federal Reserve in the International Sphere"(PDF). Retrieved April 21, 2012.
- ↑Benjamin J. Cohen, The Future of Money, Princeton University Press, 2006, ISBN 0691116660; cf. "the dollar is the de facto currency in Cambodia", Charles Agar, Frommer's Vietnam, 2006, ISBN 0471798169, p. 17
- ↑Benjamin J. Cohen, The Future of Money, Princeton University Press, 2006, ISBN 0691116660; cf. "the dollar is the de facto currency in Cambodia", Charles Agar, Frommer's Vietnam, 2006, ISBN 0471798169, p. 17
- ↑"Biggest game in town". BBC News. January 29, 2009.
- ↑"Currency Composition of Official Foreign Exchange Reserves (COFER) – June 30, 2011"(PDF). Retrieved April 21, 2012.
- ↑Rooney, Ben (February 10, 2011). "IMF calls for dollar alternative". CNN. Archived from the original on February 12, 2011. Retrieved March 28, 2012.
- ↑Nilsen, Ella (November 14, 2023). "No place in the US is safe from the climate crisis, but a new report shows where it's most severe". CNN. Retrieved December 7, 2023.
- ↑Hsiang, Solomon; Kopp, Robert; Jina, Amir; Rising, James; Delgado, Michael; Mohan, Shashank; Rasmussen, D. J.; Muir-Wood, Robert; Wilson, Paul; Oppenheimer, Michael; Larsen, Kate (June 30, 2017). "Estimating economic damage from climate change in the United States". Science. 356 (6345): 1362–1369. Bibcode:2017Sci...356.1362H. doi:10.1126/science.aal4369. ISSN 0036-8075. PMID 28663496. S2CID 217546780.
- ↑Heidari, Hadi; Arabi, Mazdak; Warziniack, Travis; Kao, Shih-Chieh (June 2021). "Shifts in hydroclimatology of US megaregions in response to climate change". Environmental Research Communications. 3 (6): 065002. Bibcode:2021ERCom...3f5002H. doi:10.1088/2515-7620/ac0617. ISSN 2515-7620. S2CID 235367031.
- ↑Egan, Matt (September 9, 2020). "US report warns climate change could create economic chaos". CNN. Retrieved May 14, 2024.
- ↑"CFTC's Climate-Related Market Risk Subcommittee Releases Report" (Press release). Commodity Futures Trading Commission. September 9, 2020. Retrieved May 14, 2024.
- ↑Managing Climate Risk in the U.S. Financial System(PDF) (Report). Commodity Futures Trading Commission. 2020. p. ii. ISBN 978-0-578-74841-2. Retrieved May 14, 2024.
- ↑Newburger, Emma (October 21, 2021). "U.S. government agency in charge of financial stability weighs in on climate change risks". CNBC. Retrieved April 28, 2023.
- ↑"Financial Stability Oversight Council Identifies Climate Change as an Emerging and Increasing Threat to Financial Stability" (Press release). U.S. Treasury Department. October 21, 2021. Retrieved April 28, 2023.
- ↑Report on Climate-Related Financial Risk 2021(PDF) (Report). U.S. Treasury Department. October 21, 2021. Retrieved April 28, 2023.
- ↑Geide-Stevenson, Doris; La Parra-Perez, Alvaro (2024). "Consensus among economists 2020—A sharpening of the picture". Journal of Economic Education. 55 (4). Taylor & Francis: 461–478. doi:10.1080/00220485.2024.2386328.
- ↑Hillyer, Jack; Licea, Mark; Lee, Juhohn; Jacobson, Lindsey (March 17, 2024). "Economists discuss the effects of climate change on the U.S. economy". CNBC. Retrieved May 20, 2024.
- ↑The Impact of Climate Change on American Household Finances(PDF) (Report). U.S. Treasury Department. September 29, 2023. Retrieved June 9, 2024.
- ↑"U.S. Department of the Treasury Releases Report on Climate Change and Household Finances" (Press release). U.S. Treasury Department. September 29, 2023. Retrieved June 9, 2024.
- ↑"FACT SHEET: The Impact of Climate Change on American Household Finances" (Press release). U.S. Treasury Department. September 29, 2023. Retrieved June 9, 2024.
- ↑Medintz, Scott (April 16, 2024). "Climate Change Could Cost Each American Born Today $500,000". Consumer Reports. Retrieved June 9, 2024.
- ↑Harto, Chris; Grose, Alexandra. "Consumer Reports: As Earth Day arrives, the lifetime cost of climate change for a baby born in the U.S. in 2024 could be nearly $500,000" (Press release). Consumer Reports. Retrieved June 9, 2024.
- ↑Cost of Climate Change to an American Born in 2024(PDF) (Report). Consumer Reports. February 23, 2024. Retrieved June 9, 2024.
- 12Burke, Marshall; Zahid, Mustafa; Diffenbaugh, Noah S.; Hsiang, Solomon (March 25, 2026). "Quantifying climate loss and damage consistent with a social cost of carbon". Nature. 651: 959–966. doi:10.1038/s41586-026-10272-6.
- ↑"2019 - Cpi". January 24, 2020. Archived from the original on March 27, 2020. Retrieved April 18, 2020.
- ↑"2018 - Cpi". January 29, 2019. Archived from the original on April 27, 2019. Retrieved April 19, 2020.
- ↑"Enabling Trade Index 2014". World Economic Forum.
- ↑"2014 Global Competitiveness Report"(PDF).
- 12"2014 Index of Economic Freedom – United States". Heritage Foundation. Archived from the original on March 20, 2012. Retrieved January 14, 2014.
- ↑Terry, Miller (January 13, 2014). "America's Dwindling Economic Freedom Regulation, taxes and debt knock the U.S. out of the world's top 10". The Wall Street Journal. Retrieved January 14, 2014.
- ↑"2014 Index of Economic Freedom". Heritage Foundation. Archived from the original on November 17, 2010. Retrieved January 14, 2014.
- ↑Alan S. Blinder (2018). Advice and Dissent: Why America Suffers When Economics and Politics Collide. Basic Books. ISBN 978-0465094172.
- ↑Carmen M. Reinhart; Kenneth S. Rogoff. "This Time is Different". reinhartandrogoff.com. Anchor Media Works.
- 123456Regulation and Control in the U.S. Economy: About.com
- ↑"Bush's Regulatory Kiss-Off – Obama's assertions to the contrary, the 43rd president was the biggest regulator since Nixon". Reason magazine. January 2009. Archived from the original on September 2, 2009. Retrieved February 12, 2012.
- ↑Porter, Eduardo (August 14, 2012). "America's Aversion to Taxes". The New York Times. Retrieved August 15, 2012.
In 1965, taxes collected by federal, state and municipal governments amounted to 24.7 percent of the nation's output. In 2010, they amounted to 24.8 percent. Excluding Chile and Mexico, the United States raises less tax revenue, as a share of the economy, than every other industrial country.
- ↑"Index of Economic Freedom: United States". Index of Economic Freedom. Archived from the original on March 20, 2012. Retrieved February 12, 2012.
- ↑"Is the US Really a Nation of God-Fearing Darwin-Haters?". Der Spiegel. June 6, 2009.
- 12Yglesias, Matthew (March 6, 2013). "America Does Tax Wealth, Just Not Very Intelligently". Slate. Retrieved March 18, 2013.
- ↑"The Distribution of Household Income and Federal Taxes, 2010". The US Congressional Budget Office (CBO). December 4, 2013. Retrieved August 13, 2014.
- ↑Prasad, M.; Deng, Y. (April 2, 2009). "Taxation and the worlds of welfare"(PDF). Socio-Economic Review. 7 (3): 431–57. doi:10.1093/ser/mwp005.
- ↑Matthews, Dylan (September 19, 2012). "Other countries don't have a "47%"". The Washington Post. Retrieved October 29, 2013.
- ↑Stephen, Ohlemacher (March 3, 2013). "Tax bills for rich families approach 30-year high". The Seattle Times. Associated Press. Retrieved April 3, 2013.
- ↑Bair, Sheila (February 26, 2013). "Grand Old Parity". The New York Times. Retrieved March 18, 2013.
- ↑Hodge, Scott A. (April 29, 2005). "The Case for a Single-Rate Tax: Why Our Progressive Tax Code is Inconsistent with the Changing Face of American Taxpayers". Tax Foundation. Archived from the original on December 22, 2015. Retrieved August 13, 2014.
- ↑Frank, Robert (March 26, 2011). "The Price of Taxing the Rich: The top 1% of earners fill the coffers of states like California and New York during a boom – and leave them starved for revenue in a bust". The Wall Street Journal. Retrieved August 13, 2014.
- ↑"Switzerland ranked second-worst global facilitator of tax avoidance". SWI swissinfo.ch. May 18, 2022. Retrieved June 28, 2022.
- 1234"CBO Budget and Economic Outlook 2018–2028". April 9, 2018.
- ↑"General government spending". OECD.
- ↑"Debt Myths, Debunked". U.S. News. December 1, 2016.
- ↑"U.S. Budget 2001". Archived from the original on January 12, 2012.
- ↑"CIA World Factbook-Debt to GDP". Archived from the original on June 13, 2007.
- ↑Kumar, Vishesh. "Is Rising U.S. Debt Inviting Trouble? Ask Japan". Daily Finance. Retrieved May 18, 2010.
- ↑"United States Defense Industrial Base: How does it differ from the European defence technological and industrial base? | Think Tank | European Parliament". Archived from the original on April 20, 2026. Retrieved June 18, 2026.
- ↑Anderson, Jack (May 22, 2006). "Tax Misery & Reform Index". Forbes. Retrieved November 17, 2008.
- ↑"2025 Small Business Profile - United States"(PDF). U.S. Small Business Administration Office of Advocacy. Retrieved May 8, 2026.
- ↑Cuccinello, Hayley (June 19, 2025). "The U.S. added a thousand new millionaires a day in 2024: Report". CNBC. Retrieved May 8, 2026.
- ↑Lebrun, Sylvan. "The Countries With The Most Billionaires 2025". Forbes. Archived from the original on April 1, 2025. Retrieved May 8, 2026.
- ↑"Fortune Announces 2025 Fortune Global 500 List". Yahoo! Finance. July 29, 2025. Retrieved May 8, 2026.
- ↑Walker, William (1993). "National Innovation Systems: Britain". In Nelson, Richard R. (ed.). National innovation systems : a comparative analysis. New York: Oxford University Press. pp. 61–64. ISBN 978-0195076172.
- ↑"U.S. Department of state: How the U.S. Economy Works". Archived from the original on November 14, 2008.
- ↑"Trends in International Migration 2002: Continuous Reporting System on Migration". Organisation for Economic Co-Operation and Development (2003). OECD Publishing. p. 280. ISBN 9264199497
- ↑Peter S. Canellos (November 11, 2008). "Obama victory took root in Kennedy-inspired Immigration Act". The Boston Globe. Retrieved November 14, 2008.
- ↑Jeanette Altarriba; Roberto R. Heredia (2007). An Introduction to Bilingualism: Principles and Processes. Taylor & Francis. p. 212. ISBN 978-0203927823.
- ↑Porter, Eduardo (June 15, 2019). "This Economy Is Not Aging Gracefully". The New York Times. Retrieved June 15, 2019.
- ↑"Updated Budget Projections: 2019 to 2029". Congressional Budget Office. May 2, 2019. Retrieved June 15, 2019.
- ↑Benedetti, François (December 17, 2003). "100 Years Ago, the Dream of Icarus Became Reality". Fédération Aéronautique Internationale (FAI). Archived from the original on September 12, 2007. Retrieved August 15, 2007.
- 12Shane, Scott "A General Theory of Entrepreneurship: the Individual-Opportunity Nexus", Edward Elgar
- ↑Reynolds, Paul D. "Entrepreneurship in the United States", Springer, 2007, ISBN 978-0387456676
- ↑"Mandelson, Peter. "There is no Google, or Amazon, or Microsoft or Apple in the UK, Mandelson tells BVCA." BriskFox Financial News, March 11, 2009". Briskfox.com. Archived from the original on November 3, 2019. Retrieved April 21, 2012.
- ↑Venture Impact (5 ed.). IHS Global Insight. 2009. p. 2. ISBN 978-0978501570. Archived from the original on June 30, 2014.
- 1234567891011121314Stewart, Shannon; Springs, Stacy (2015). United States of America. In: UNESCO Science Report: towards 2030(PDF). Paris: UNESCO. pp. 129–55. ISBN 978-9231001291.
- ↑Sohl, Jeffrey (March 31, 2010). "Full Year 2009 Angel Market Trends"(PDF). University of New Hampshire Center for Venture Research. Archived from the original(PDF) on January 20, 2013. Retrieved September 27, 2011.
- ↑"The United States of Entrepreneurs". The Economist. March 12, 2009.
- 123"M&A US – Mergers & Acquisitions in the United States". IMAA-Institute. Retrieved February 22, 2018.
- ↑"The Global Financial Centres Index 31". Longfinance.net. Retrieved August 14, 2022.
- ↑Hoover, Gary (June 26, 2022). "2022 UPDATED Largest Companies Charts". Business History - The American Business History Center. Retrieved February 9, 2023.
- ↑"Companies ranked by Market Cap - CompaniesMarketCap.com". companiesmarketcap.com. Retrieved February 9, 2023.
- ↑"The 2020 World's Most Valuable Brands". Forbes. Retrieved February 9, 2023.
- ↑"How to protect yourself against the theft of your identity". The Economist. ISSN 0013-0613. Retrieved February 10, 2023.
- ↑"Big 4 wireless carriers spent $100B on 5G spectrum: Was it worth it?". www.spglobal.com. Retrieved February 10, 2023.
- ↑"Global 500 2016". Fortune. Archived from the original on September 21, 2018. Retrieved June 22, 2017. Number of companies data taken from the "Country" filter.
- ↑"The 10 Largest Coal Mining Companies In The United States – Zippia". July 26, 2022. Retrieved February 10, 2023.
- ↑Desjardins, Jeff (November 24, 2017). "Chart: The Evolution of Standard Oil". Visual Capitalist. Retrieved February 10, 2023.
- ↑Deloitte, Switching Channels: Global Powers of Retailing 2012, STORES, January 2012, G20.
- ↑"IHS iSuppli Semiconductor preliminary rankings for 2011". Archived from the original on December 14, 2013. Retrieved April 21, 2012.
- ↑"Top 10 Semiconductor Manufacturers in the U.S. - IndustrySelect®". www.industryselect.com. Retrieved February 10, 2023.
- ↑House, The White (August 9, 2022). "FACT SHEET: CHIPS and Science Act Will Lower Costs, Create Jobs, Strengthen Supply Chains, and Counter China". The White House. Retrieved February 10, 2023.
- ↑Girardin, McKayla (September 22, 2022). "Top Tech Companies in 2022". Forage. Retrieved February 10, 2023.
- ↑"Top 1000 Technology Companies United States 2023". Disfold Data. Retrieved February 10, 2023.
- 12"WFE – YTD Monthly". November 6, 2011. Archived from the original on November 6, 2011. Retrieved June 8, 2014.
- ↑"> Data Products > NYSE > Facts & Figures". NYXdata. Archived from the original on February 28, 2009. Retrieved April 21, 2012.
- ↑"NASDAQ Performance Report". NASDAQ Newsroom. The Nasdaq Stock Market. January 12, 2007. Archived from the original on February 10, 2007. Retrieved February 15, 2007.
- ↑Origins of Stock Market FluctuationsArchived September 23, 2015, at the Wayback Machine. New York University, December 16, 2014.
- ↑Stock quotes, investing & personal finance, news – MSN MoneyArchived May 6, 2013, at the Wayback Machine. Money.msn.com (December 31, 1999).
- ↑secdatabase.com
- ↑Investor Relations. Goldman Sachs.
- ↑"Financial and investor information from U.S. Bank". usbank.com. Archived from the original on October 12, 2018. Retrieved May 6, 2013.
- ↑Tankersley, Jim (December 16, 2014). "A black hole for our best and brightest". The Washington Post. Retrieved December 23, 2014.
- ↑Cecchetti, Stephen G; Kharroubi, Enisse. "Why does financial sector growth crowd out real economic growth?"(PDF). BIS Working Papers No 490. Bank for International Settlements. Retrieved September 20, 2015.

Further reading
 This article incorporates text from a free content work.Licensed under CC BY-SA IGO 3.0.Text taken from UNESCO Science Report: towards 2030,141–143,UNESCO Publishing.
- Gordon, Robert J. (1986). The American Business Cycle: Continuity and Change. Chicago: University of Chicago Press. ISBN 0-226-30452-3.
- Economy of the United States
- OECD member economies
- World Trade Organization member economies